Workforce Benchmarks Calculator: HR Metrics + Industry Data
Enter your turnover, retention, time to fill, and span of control to see exactly how your workforce stacks up against 2025 industry benchmarks.
Calculate now ↓What Are Workforce Benchmarks?
Workforce benchmarks are reference points that show how your HR metrics compare to what other organizations report. They answer one question: is this number normal, or is it a signal?
Every HR team tracks data on turnover, hiring speed, manager structure, and retention. But data without context is hard to act on. A turnover rate of 22% could indicate excellent retention at a distribution company or a serious problem at a professional services firm. Workforce benchmarks supply that context.
The most useful benchmarks come from real organizational data at scale, segmented by industry, company size, and region. They show the full distribution, not just a single average, so you can see whether your number is in the bottom quarter, the middle, or the top of the range.
Four metrics form the foundation of workforce health benchmarking: turnover rate, retention rate, time to fill, and span of control. Together, they reflect how well you hold onto people, how quickly you replace them, and whether your management structure supports sustainable growth.
Why Workforce Benchmarks Matter for Your Organization
Workforce benchmarks transform HR data from a reporting exercise into a strategic argument. Without context, you're answering "what happened?" With benchmarks, you're answering "how does it compare, and what should we do about it?"
Four outcomes make benchmarks worth tracking:
Retention risk identification. A retention rate below the 25th percentile means your organization loses people faster than 75% of comparable companies. SHRM estimates replacing a single employee costs between 50% and 200% of their annual salary, depending on role seniority. Organizations that don't benchmark their retention often underestimate what attrition is actually costing them.
Hiring efficiency. If your time to fill averages 60 days, you're carrying open roles two weeks longer than the 75th percentile benchmark. That gap represents lost productivity, strained teams, and a recruiting process that may need structural changes.
Management leverage. Span of control directly shapes labor cost. Adding two direct reports per manager across 50 managers removes 100 positions from the org chart. Benchmarks help HR build the case for structural changes at the board or PE level.
Investor and board credibility. PE-backed companies and public boards increasingly expect HR to show workforce health relative to industry peers. Benchmarks make that conversation possible.
How to Calculate Your Key Workforce Metrics
The Workforce Benchmarks Calculator handles the math once you input your data. Understanding what goes into each metric helps you pull the right numbers and interpret the output clearly.
Turnover Rate Divide the number of departures during a period by the average headcount for that period, then multiply by 100: Turnover Rate = (Departures ÷ Average Headcount) × 100
A PE-backed logistics company with 800 employees and 144 departures last year has a turnover rate of 18%.
Retention Rate Divide the number of employees who stayed throughout the period by the headcount at the start of the period, then multiply by 100: Retention Rate = (Employees Who Stayed ÷ Starting Headcount) × 100
That same company, starting the year with 820 employees and ending with 676 who remained the full year, has an 82.4% retention rate.
Time to Fill Average the days between when a position opens and when it is filled: Time to Fill = Total Days to Fill ÷ Positions Filled
Filling 30 roles at an average of 47 days each produces a 47-day time to fill.
Span of Control Divide total direct reports across the organization by the total number of managers: Span of Control = Total Direct Reports ÷ Total Managers
A company with 640 individual contributors and 80 managers has a span of control of 8.0.
What Typical Results Look Like
Based on HRBench 2025 benchmark data from thousands of organizations, here is the national distribution for each metric:
Turnover Rate. The national median is 21.5%. Top-quarter organizations report turnover below 14.2%. Above 29.4% places you in the bottom quarter, which typically warrants a root-cause investigation around first-year attrition and departure by manager. Frontline-heavy industries like logistics, care, and hospitality run structurally higher than technology or professional services.
Retention Rate. The national median is 82.3%. Organizations in the top quarter maintain rates above 87.5%. A retention rate below 77.9% signals a workforce losing people faster than most comparable organizations. Above 85% is achievable in most industries and indicates enough stability to support growth.
Time to Fill. The national median is 43 days. Organizations filling roles in fewer than 28 days rely on active internal pipelines and employee referral programs. Roles taking longer than 52 days typically have sourcing bottlenecks, approval delays, or compensation expectations that don't match the market.
Span of Control. The national median is 5.7 direct reports per manager. Spans above 7.6 reduce labor cost but strain manager capacity. Spans below 4.4 across the full organization often signal excess management layers and elevated overhead.
Internal trends matter as much as external benchmarks. A retention rate of 84% declining over three consecutive quarters is more urgent than a rate of 79% that has been steady.
How to Use Your Benchmark Results
Benchmarks show where you stand. These four steps determine what to do next.
Share the comparison with your leadership team. Benchmark data is most effective when it reframes HR metrics as business metrics. A turnover rate in the bottom quarter of your industry is not an HR problem. It is a margin problem. Pair benchmark results with a cost-of-turnover estimate before presenting to the CEO or CFO.
Set the right priority. You cannot move every metric at once. Use your benchmark results to identify the one or two metrics where your gap is largest and where improvement would have the most downstream impact. Retention and turnover are usually the highest-leverage starting points because both connect directly to cost.
Track trends, not just snapshots. Run the benchmark comparison quarterly. A single data point shows where you are. Three or four in sequence show whether you are improving or declining.
Connect to related metrics. Benchmark results create better questions, not final answers. If your span of control is narrow, check whether that is protecting manager effectiveness or adding unnecessary overhead. If time to fill is long, look at offer acceptance rates and sourcing channel performance alongside it.
How HRBench tracks this
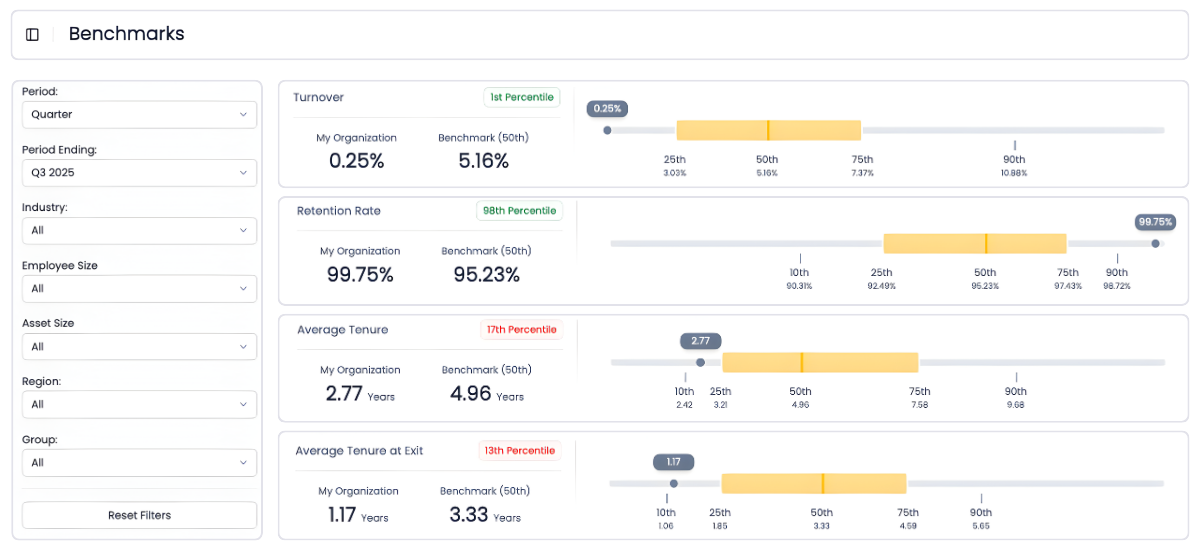
The Workforce Benchmarks Calculator takes your turnover rate, retention rate, time to fill, and span of control and places each one against the HRBench 2025 national benchmark distribution. Enter your organization's numbers and you see exactly which percentile you fall in for each metric. The gated benchmark data extends the comparison to your specific industry and company size, showing whether your results are expected for an 800-person logistics operation or an outlier among comparable peers. Enter your metrics in the calculator above to see where your workforce stands.
Related Resources


Frequently Asked Questions
If you don't find the information you're looking for, please don't hesitate to contact us directly, and our team will be happy to assist you.
The national median turnover rate is 21.5%, according to HRBench 2025 benchmark data. What counts as "good" depends heavily on your industry. Frontline-heavy sectors like logistics, hospitality, and healthcare typically run 25-35%. Professional services and technology organizations often stay below 15%. A more useful question: is your rate improving? Organizations with turnover above 29.4% in traditionally lower-turnover industries should treat the gap as a priority indicator, not background noise.
Turnover rate counts departures as a percentage of average headcount. Retention rate counts the employees who remained from the start of a period to the end. They measure the same workforce behavior from opposite directions, but they are not interchangeable. A company can have a 20% turnover rate and an 82% retention rate in the same year if average headcount shifted. For board reporting and investor communication, retention rate is better for demonstrating workforce stability. Turnover rate is better for diagnosing where exits are concentrated.
The national median time to fill is 43 days, but frontline roles in high-volume environments often close faster — sometimes in 14 to 21 days for hourly positions when pipelines are active. The most relevant benchmark is your own historical baseline compared to comparable peers. If your time to fill for frontline roles consistently exceeds 40 days, review your sourcing mix: employee referrals typically close in 29 days versus 39-42 days from job boards.
There is no single target, but the national median is 5.7 direct reports per manager. Frontline supervision in standardized environments like distribution, retail, and manufacturing can scale to 10-15 direct reports without significant quality loss. Senior leadership typically spans 4-7 to maintain strategic focus. A span below 4.4 across your full organization often indicates excess management layers, which increases labor cost and slows decision-making. Organizations growing through acquisition frequently inherit spans that are too narrow in acquired units and need structural adjustment.
PE firms most often focus on turnover rate, retention rate, and time to fill during workforce due diligence. High turnover signals culture or compensation risk. Slow time to fill signals recruiting capacity constraints. Declining retention after close can indicate integration problems. Span of control is increasingly reviewed as a labor cost efficiency indicator. Having benchmark comparisons ready before a deal process begins rather than assembling them under deadline gives HR leaders a significant credibility advantage at the board level.
See your workforce data in 20 minutes
Book a personalized walkthrough and get a custom benchmark report built from your own headcount, turnover, and cost data. You'll leave the call knowing exactly what HRBench can surface from your HRIS, ATS, and engagement systems.
- A live walkthrough mapped to your company size, industry, and systems
- A custom benchmark report comparing your metrics to peer companies
- A clear view of what an HRBench rollout would look like for your team