What took 3 years in Tableau takes 1 month in HRBench
Tableau is a world-class visualization platform. But when your HR team needs workforce dashboards, you're writing calculated fields, building data models, and waiting months for analytics that still don't include benchmarks. HRBench delivers 45+ auto-calculated HR metrics, executive-ready dashboards, and predictive analytics. Live in under a week. No LOD expressions. No data modeling. No BI developer required.
Trusted by HR leaders at:

Why Tableau isn't the right tool for HR analytics
How HRBench Compares to Tableau for HR Analytics
Tableau is a best-in-class visual analytics platform. HRBench is a best-in-class HR analytics platform. Here's what that difference means in practice.
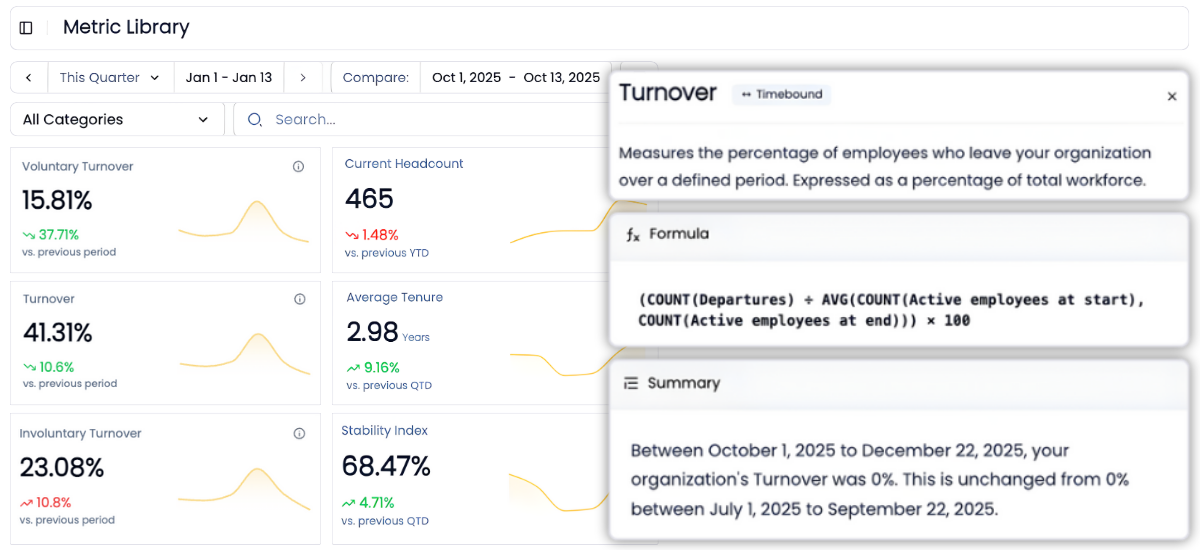
45+ auto-calculated HR metrics making your data instantly actionable.
In Tableau, every HR metric must be manually defined using calculated fields and LOD expressions. Turnover rate, retention rate, time to fill, cost per hire, span of control. Each one requires custom logic, date calculations, and testing. One wrong formula and your board deck has bad data.
HRBench auto-calculates 45+ workforce metrics the moment your data connects. The calculation logic is built by HR analytics experts who understand how these metrics should work across different industries, company sizes, and data structures.
No calculated fields. No LOD expressions. No edge cases to handle.
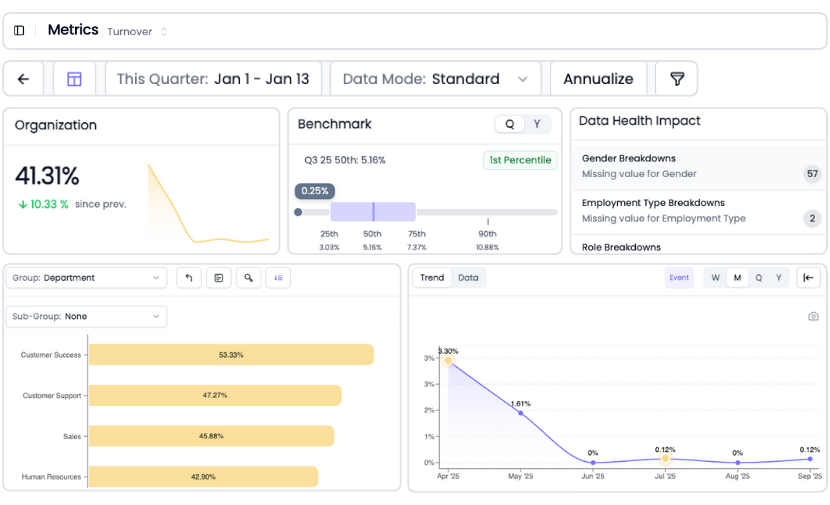
Go from overview to drilling into every metric for insights in a few clicks
Every metric in HRBench is fully drillable.
Click into any tile to explore historical trends, department-level breakdowns, and benchmarks by industry, size, region, and more.
Tableau offers powerful drill-down when properly configured. But configuring it requires data relationships, hierarchy definitions, and calculated fields at each level. HRBench puts the drill-down one click away for any team member. No data model required.
Industry benchmarks included with every metric so you know where you stand
Tableau has no workforce benchmarks. None.
If your CEO asks "is our 18% turnover rate good or bad?" Tableau has no answer. To get one, you'd need to purchase benchmark data from PwC Saratoga or Mercer, negotiate a subscription, import the data into your workbook, model it alongside your HR data, and build comparison views. That's a project measured in weeks.
HRBench includes benchmarks for every metric from day one. Industry, company size, and region. Every dashboard view shows how you compare without a separate purchase, import project, or data model.

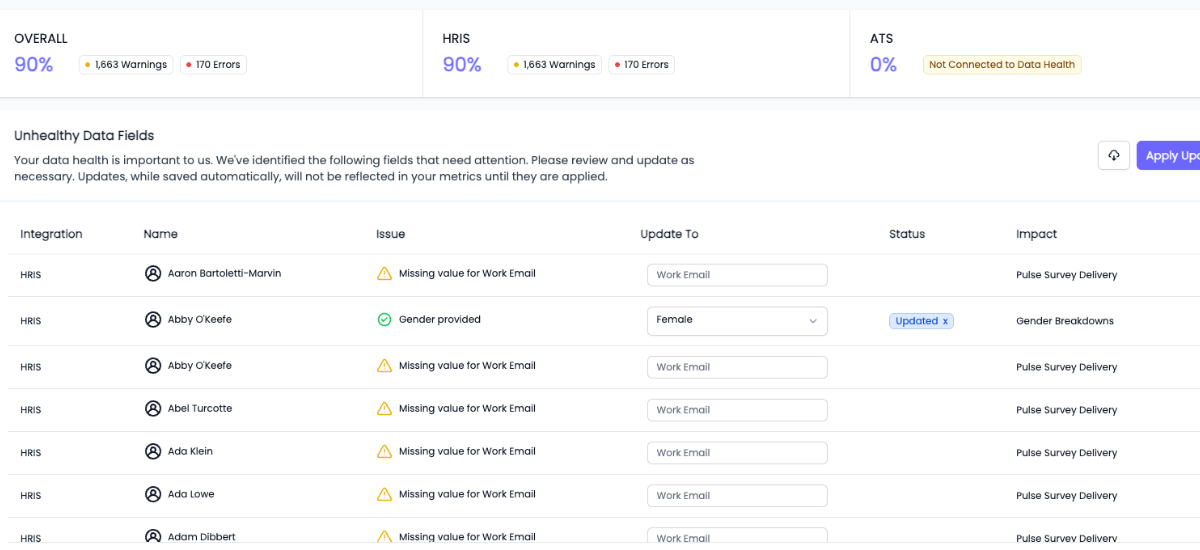
Built-in data health monitoring, so you're confident with clean, validated data
You can't report what you can't trust.
HRBench scans every metric for missing or incomplete data fields and highlights what needs attention, so your reports are always built on clean, complete data.
Tableau has no built-in data validation for HR data. Missing fields, duplicates, and inconsistencies surface only when reports look wrong or leadership questions the numbers. By then, your credibility has already taken the hit.
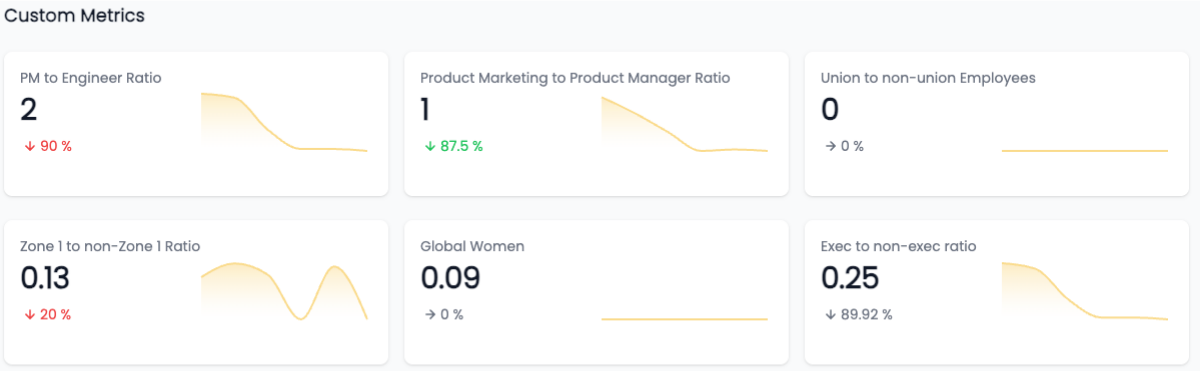
Custom metrics, no SQL required
Need to track something unique to your business?
We support fully custom metrics, built by our team, shown alongside our 45+ standard metrics, and filterable just like the rest.
In Tableau, custom metrics mean more calculated fields. More LOD expressions. More workbook maintenance. More dependencies on your BI developer. HRBench takes the opposite approach: tell us what you need, and we build it for you.
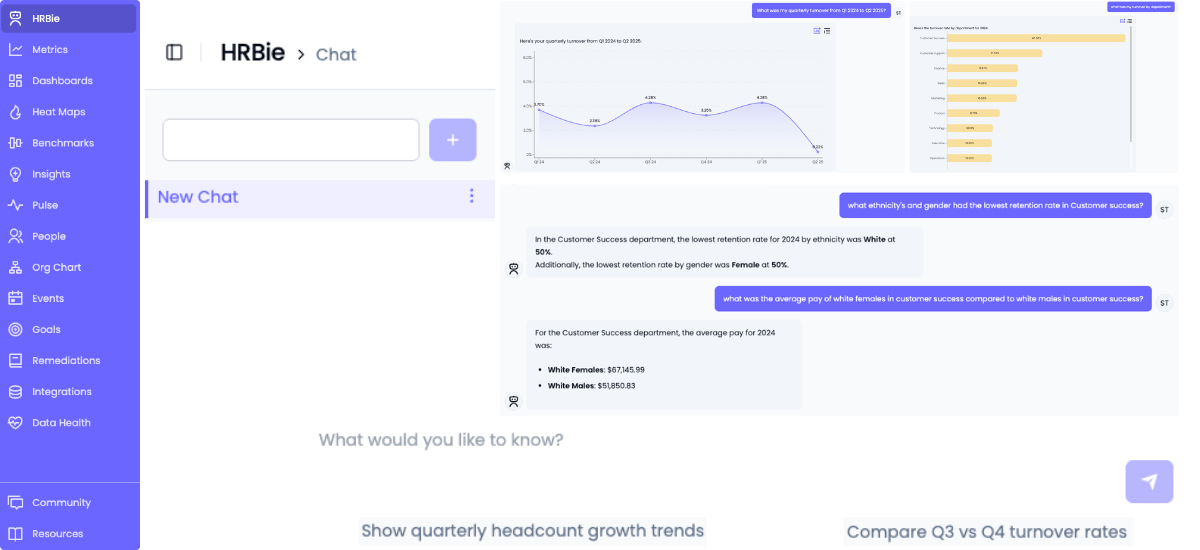
An AI assistant that actually understands HR questions
Tableau is investing heavily in AI through Tableau Next, its agentic analytics platform. Tableau Next introduces AI agents for pattern discovery, natural language queries, and workflow integration. It's an impressive vision for the future of analytics.
But there are important considerations for HR teams. Tableau Next requires a Tableau+ subscription (enterprise pricing, contact sales). Full generative AI features require replicating your data into Salesforce Data Cloud. And the AI is general-purpose. It doesn't natively understand regrettable attrition, flight risk scoring, span of control benchmarks, or workforce planning scenarios.
HRBie is HRBench's AI assistant built for HR. Ask questions like "What's driving turnover in engineering?" or "How does our retention compare to industry benchmarks?" and get instant answers with visualizations. HRBie works from day one because HRBench's 45+ metrics are already calculated. No Tableau+ subscription. No Salesforce Data Cloud. No additional cost.
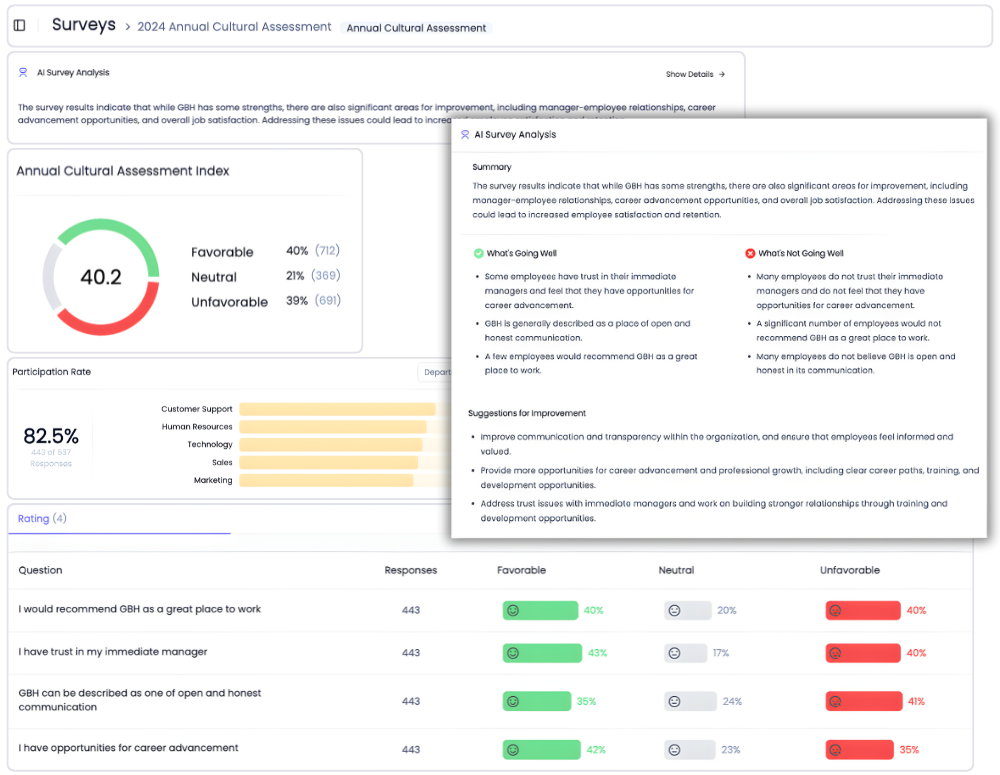
Engagement surveys included, not a separate vendor
Tableau has no native survey tools. To connect engagement data with workforce analytics, you need a separate survey vendor (Culture Amp, Qualtrics, Glint), an integration project, and ongoing maintenance to keep the two systems in sync.
HRBench includes eNPS, pulse surveys, full engagement surveys, and exit interviews for every customer. Survey data flows directly into the same dashboards as your headcount, turnover, retention, and recruiting metrics.
Want to see the connection between low engagement and high attrition in one view? That's the default in HRBench. In Tableau, it's a multi-vendor integration project that most HR teams never complete.
What happens when HR teams stop building dashboards from scratch
Most HR teams spend weeks pulling reports, cleaning spreadsheets, and stitching together dashboards across systems.
HRBench Analytics eliminates the manual work, so you can focus on driving action.
The conversations have changed from, ‘Here’s the data,’ to ‘I see the trend and the root cause.
.png)
Of my vendors, HRBench is the top of my list. We held onto trailing data from our prior system and integrated it seamlessly. Our team had to do zero lift.

“HRBench gave us confidence. We weren’t spending hours building dashboards anymore. We could focus on strategy, not reporting.”
.jpg)
Frequently Asked Questions
Common questions from HR teams comparing Visier and HRBench.
No. HRBench is a purpose-built HR analytics platform that complements your existing BI stack. It adds dedicated HR analytics with pre-calculated workforce metrics, benchmarks, predictive analytics, and engagement surveys.
You can, but building comprehensive HR analytics in Tableau requires calculated field expertise, LOD expressions, data modeling, custom HRIS integration development, and months to years of development time. One customer spent 3 years. HRBench delivers all of this out of the box in under a week.
HRBench works alongside Tableau. It adds workforce benchmarks, predictive analytics, engagement correlation, and data health monitoring without disrupting your existing Tableau workbooks.
Tableau Cloud ranges from $15-$115/user/month depending on role and edition. Total HR analytics cost includes HRIS integration development, benchmark data subscriptions, BI developer time, training ($1,200-$2,000/course), and implementation ($50K-$200K). HRBench offers all-inclusive pricing with everything included.
HRBench customers go live in under 7 days. Comprehensive HR analytics in Tableau takes 6-12+ months from scratch. One customer reported 3 years of Tableau development before switching.
Yes. HRBench includes eNPS, pulse surveys, full engagement surveys, and exit interviews. Tableau has no native survey tools.
Tableau Next requires a Tableau+ subscription and Salesforce Data Cloud for full AI features. HRBie is an HR-specific AI assistant included for every HRBench customer that works immediately because 45+ metrics are already calculated.
No. HRBench is built for HR leaders. There are no LOD expressions, no calculated fields, no data modeling. Official Tableau training costs $1,200-$2,000 per course, illustrating the skill gap for HR professionals.
Tableau is best for large enterprises with dedicated BI teams that need a flexible, general-purpose visualization platform across multiple departments.
HRBench is built for mid-market HR teams at PE-backed and growth-stage companies with 500 to 5,000 employees who need workforce analytics without hiring a BI developer, learning LOD expressions, or spending months building data models.
Salesforce acquired Tableau in 2019 and the platforms are increasingly integrated. Tableau's AI features require Salesforce Data Cloud. HRBench is an independent platform with no vendor ecosystem lock-in.
See your workforce data in 20 minutes
Book a personalized walkthrough and get a custom benchmark report built from your own headcount, turnover, and cost data. You'll leave the call knowing exactly what HRBench can surface from your HRIS, ATS, and engagement systems.
- A live walkthrough mapped to your company size, industry, and systems
- A custom benchmark report comparing your metrics to peer companies
- A clear view of what an HRBench rollout would look like for your team