Stop rebuilding the same HR report every month.
Excel is the world's most flexible tool. But when you're manually exporting HRIS data, rebuilding formulas every month, and emailing "Turnover_Report_Final_v3_UPDATED.xlsx" to your leadership team, flexibility isn't the problem. Time is. HRBench gives you 45+ auto-calculated HR metrics, executive-ready dashboards, and workforce benchmarks. Live in under a week. No formulas. No manual exports.
Trusted by HR leaders at:

Why Excel breaks down for growing HR teams
How HRBench compares to Excel for HR analytics
Excel is a powerful general-purpose spreadsheet. HRBench is a purpose-built HR analytics platform. Here's what that difference means for your reporting.
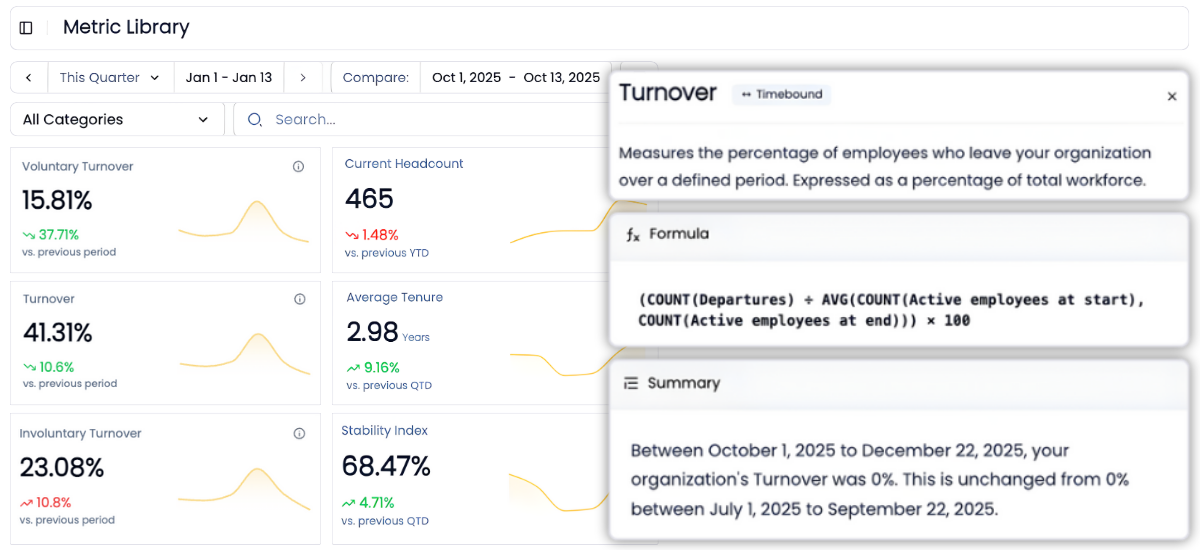
45+ auto-calculated HR metrics making your data instantly actionable.
In Excel, every HR metric is a manual formula. Turnover rate, retention rate, time to fill, cost per hire, span of control. Each one requires VLOOKUP, SUMIFS, COUNTIFS, nested IFs, date logic, and error handling. Definitions vary by person. Errors compound as complexity grows. Research shows 88% of business spreadsheets contain formula errors.
HRBench auto-calculates 45+ workforce metrics the moment your HRIS connects. The calculation logic is built by HR analytics experts who understand how these metrics should work across different industries, company sizes, and data structures.
No formulas. No definitions to write. No edge cases to handle.
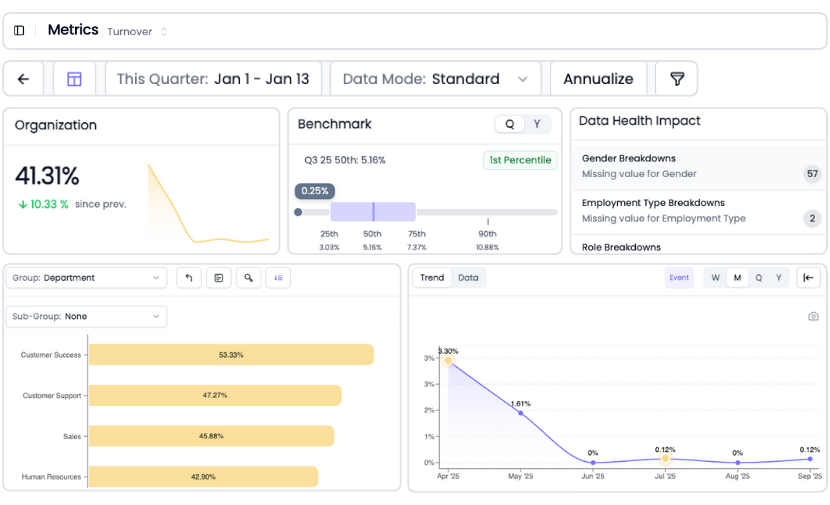
Go from overview to drilling into every metric for insights in a few clicks
Every metric in HRBench is fully drillable.
Click into any tile to explore historical trends, department-level breakdowns, and benchmarks by industry, size, region, and more.
In Excel, drilling down means filtering pivot tables, manually slicing data, and rebuilding charts to show what you need. Every drill-down is a new manual task. HRBench puts the drill-down one click away. No filtering. No new pivot table. No new chart.
Industry benchmarks included with every metric so you know where you stand
Excel has no workforce benchmarks. None.
If your CEO asks "is our 18% turnover rate good or bad?" Excel has no answer. To get one, you'd need to research benchmark providers, evaluate data quality, negotiate a subscription, download the data, map it to your metrics, and build comparison views in your spreadsheet. Most HR teams never complete this project.
HRBench includes benchmarks for every metric from day one. Industry, company size, and region. Every dashboard view shows how you compare without a separate purchase, import project, or formula.

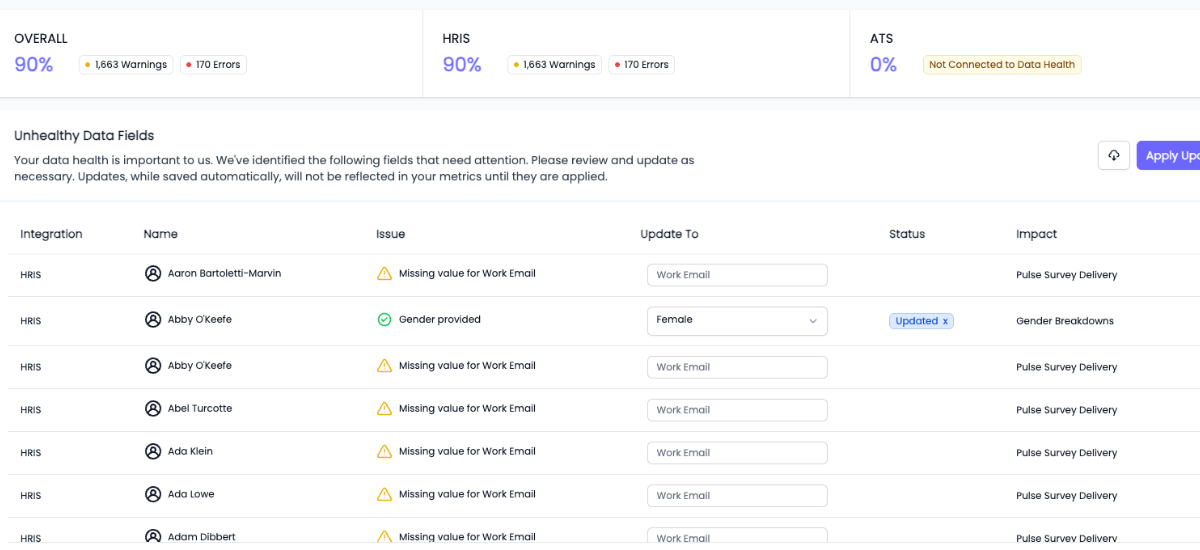
Built-in data health monitoring, so you're confident with clean, validated data
You can't report what you can't trust.
HRBench scans every metric for missing or incomplete data fields and highlights what needs attention, so your reports are always built on clean, complete data.
Excel has no data validation for HR data. Missing fields, duplicate records, and formula errors surface only when reports look wrong. Often in front of executives. By then, your credibility has already taken the hit.
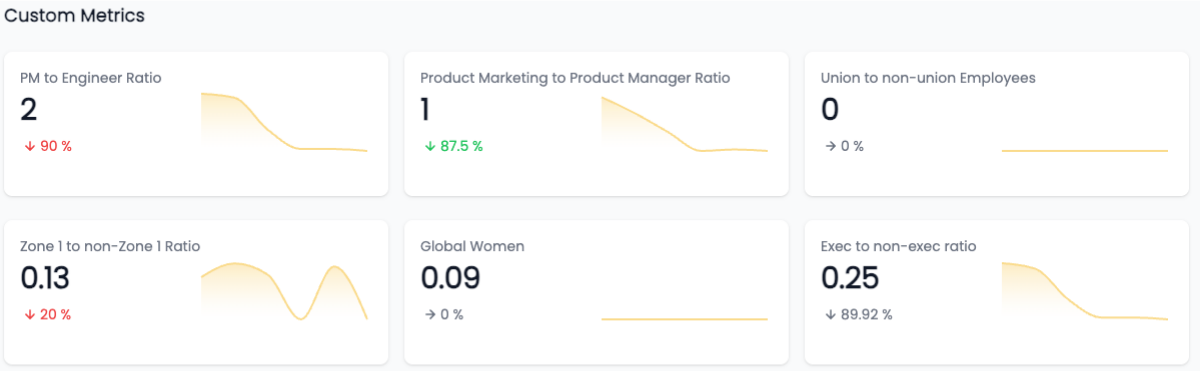
Custom metrics, no SQL required
Need to track something unique to your business?
We support fully custom metrics, built by our team, shown alongside our 45+ standard metrics, and filterable just like the rest.
In Excel, custom metrics mean more formulas. More VLOOKUPs to maintain. More cells to break when data structure changes. HRBench takes the opposite approach: tell us what you need, and we build it for you.
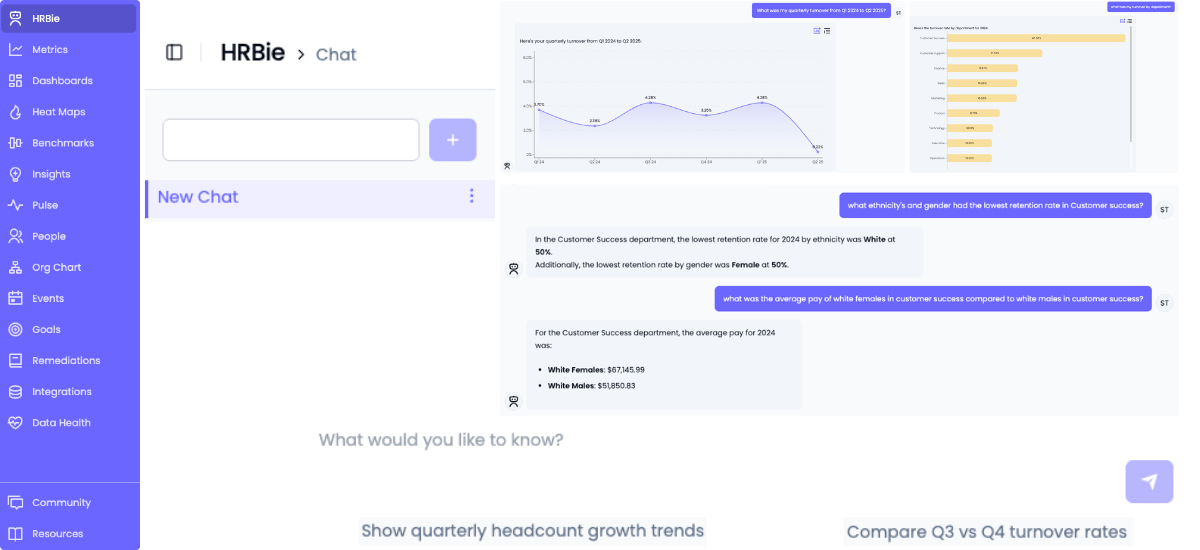
An AI assistant that actually understands HR questions
Microsoft Copilot in Excel represents a real step forward for spreadsheet productivity. It can help write formulas, analyze data patterns, and create charts from natural language prompts.
But Copilot is general-purpose AI. Ask Copilot "what's driving turnover in engineering?" and it doesn't know what turnover means in an HR context, doesn't have your HRIS data connected, and doesn't have benchmark data to compare against. It can help you build the formula, but you still need the data, the definitions, and the context. Copilot also costs $30 per user per month on top of your Microsoft 365 subscription.
HRBench includes HRBie, an AI assistant purpose-built for HR. Ask "what's driving turnover in engineering?" and get an instant answer with visualizations, trend analysis, and benchmark comparisons. HRBie works because HRBench already has your data connected, your metrics calculated, and your benchmarks loaded.
No formulas. No data preparation. No additional cost.
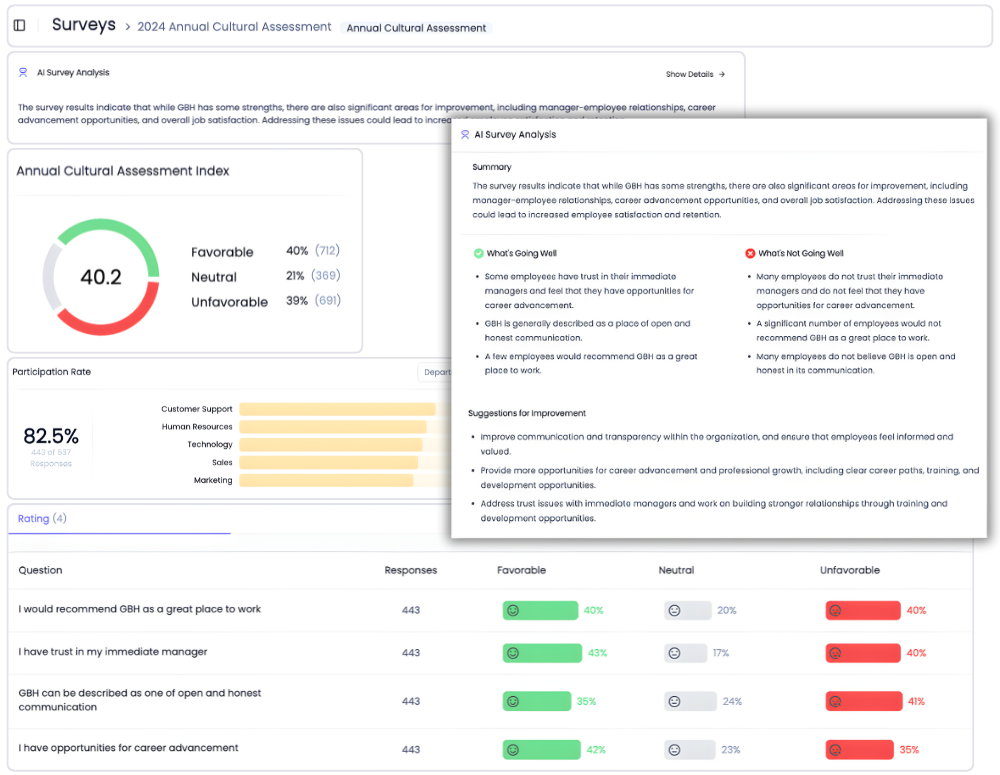
Engagement surveys included, not a separate spreadsheet to manage
Excel has no survey capabilities. Some teams use spreadsheets to manually analyze survey results exported from other tools. The result: engagement data lives in one file, turnover data lives in another, and connecting them requires more manual work.
HRBench includes eNPS, pulse surveys, full engagement surveys, and exit interviews for every customer. Survey data flows directly into the same dashboards as your headcount, turnover, retention, and recruiting metrics.
Want to see the connection between low engagement and high attrition in one view? That's the default in HRBench. In Excel, it's a multi-spreadsheet manual analysis project that gets done once, never updated.
What happens when HR teams stop rebuilding spreadsheets
Most HR teams spend weeks pulling reports, cleaning spreadsheets, and stitching together dashboards across systems.
HRBench Analytics eliminates the manual work, so you can focus on driving action.
The conversations have changed from, ‘Here’s the data,’ to ‘I see the trend and the root cause.
.png)
Of my vendors, HRBench is the top of my list. We held onto trailing data from our prior system and integrated it seamlessly. Our team had to do zero lift.

“HRBench gave us confidence. We weren’t spending hours building dashboards anymore. We could focus on strategy, not reporting.”
.jpg)
Frequently Asked Questions
Common questions from HR teams comparing Visier and HRBench.
Not entirely. Excel is still useful for quick ad-hoc data exploration. What HRBench replaces is the recurring spreadsheet cycle: monthly HRIS exports, manual formula rebuilding, static charts, version control chaos, and the 10 to 20+ hours per week your team spends on manual reporting.
Excel-based HR analytics has fundamental limitations: no HRIS integrations, no workforce benchmarks, no predictive analytics, no standardized metric definitions, no data security controls, and no real-time dashboards. According to Deloitte, 91% of organizations use spreadsheets for workforce data, but only 22% say they're effective at getting value from people analytics.
Excel's software cost is low (included with Microsoft 365 at $6 to $36 per user per month). But if your HR team spends 10 to 20+ hours per week on manual data exports and report rebuilding, that's $30,000 to $80,000+ per year in labor costs alone. HRBench eliminates that manual work with all-inclusive pricing.
HRBench is built for HR leaders, not data analysts. If your team can use basic Excel, HRBench is easier. No formulas, no pivot tables, no macros. Every dashboard is point-and-click with interactive drill-downs. Metrics are pre-calculated and benchmarks pre-loaded.
HRBench customers go live in under 7 days, some in 24 hours. Setup involves connecting your HRIS through pre-built integrations, and 45+ metrics begin calculating immediately.
Yes. HRBench connects directly to 90+ HRIS, ATS, and engagement platforms through pre-built APIs including BambooHR, ADP, UKG, Paylocity, Workday, Greenhouse, and Lever. Data syncs automatically daily, eliminating the manual export step.
Absolutely. Many customers use HRBench for ongoing reporting and dashboards while still using Excel for quick one-off analyses. The difference is that recurring reports and strategic analytics live in HRBench, not in a spreadsheet rebuilt every month.
HRBench is SOC2 certified and GDPR compliant with role-based access controls, data encryption, and full audit logging. This addresses the security gap where 63% of professionals cite concerns about spreadsheet-based HR data sitting in unencrypted files and email attachments.
Yes. HRBench includes eNPS, pulse surveys, full engagement surveys, and exit interviews for every customer. Survey data flows directly into workforce analytics dashboards.
Copilot is general-purpose AI for Excel tasks that costs $30 per user per month extra and doesn't understand HR concepts or connect to your HRIS. HRBie is an HR-specific AI assistant included with every HRBench subscription that works immediately because data is connected and metrics are calculated.
Excel is best for small HR teams (under 50 employees) with simple reporting needs, quick ad-hoc analyses, and one-time data explorations. Once you need recurring reports, benchmarks, predictive analytics, or multi-source integration, Excel becomes a bottleneck.
HRBench is built for mid-market HR teams at PE-backed and growth-stage companies with 500 to 5,000 employees who need workforce analytics and executive-ready dashboards without spending 10 to 20+ hours per week on manual spreadsheet work.
See your workforce data in 20 minutes
Book a personalized walkthrough and get a custom benchmark report built from your own headcount, turnover, and cost data. You'll leave the call knowing exactly what HRBench can surface from your HRIS, ATS, and engagement systems.
- A live walkthrough mapped to your company size, industry, and systems
- A custom benchmark report comparing your metrics to peer companies
- A clear view of what an HRBench rollout would look like for your team