Analytics for instant visibility into your entire workforce
People analytics inside HRBench connects all your HR data sources and auto-calculates 45+ core metrics. You can confidently report, benchmark, and drill into the data behind your workforce.
Schedule demo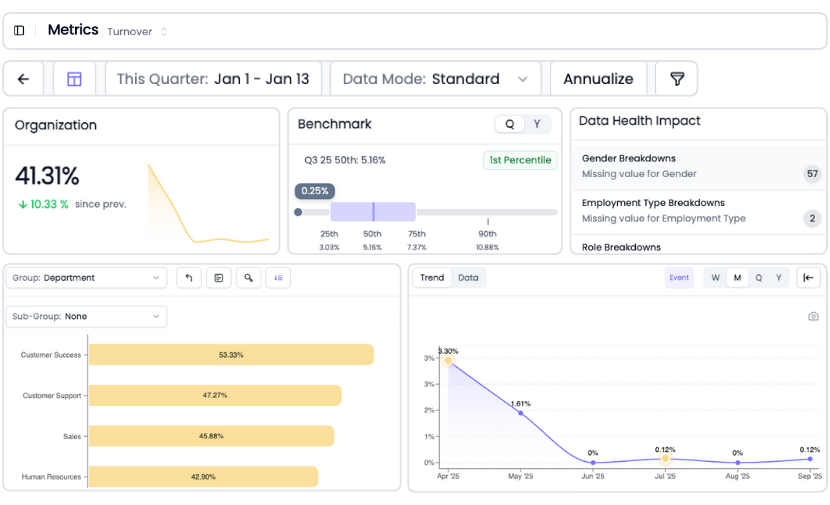
Trusted by HR leaders at:

45+ auto calculated HR metrics making your data instantly actionable.
Analytics is the central nervous system of the HRBench platform.
The moment your data is connected, we auto-calculate over 45 out-of-the-box workforce metrics—giving you fast, reliable answers to the questions your executives are already asking.
Whether you’re reporting on turnover, span of control, or retention rate, Analytics provides a clear, consistent view of your organization’s performance.
 Schedule a demo
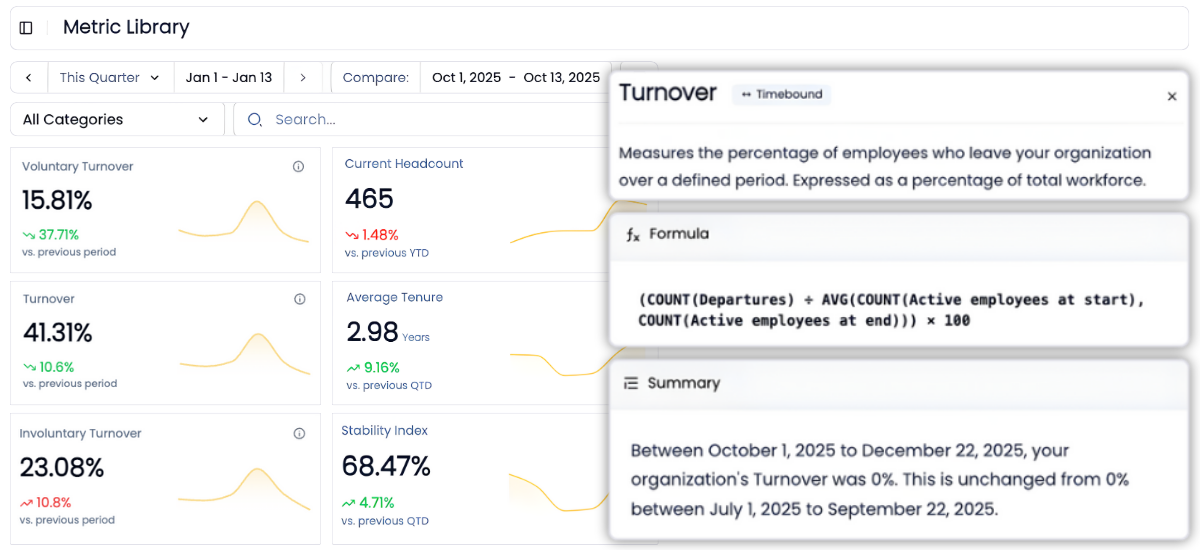
Drill into every metric for deeper insights in a few clicks
Every metric in HRBench is fully drillable.
Click into any tile to explore historical trends, department-level breakdowns, and benchmarks by industry, size, region, and more.
Need more context? Filter by role, gender, employment type—or subgroup by team, location, or tenure band to tell a more detailed story.
 Schedule a demo
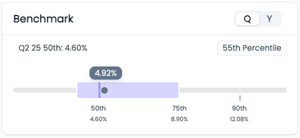
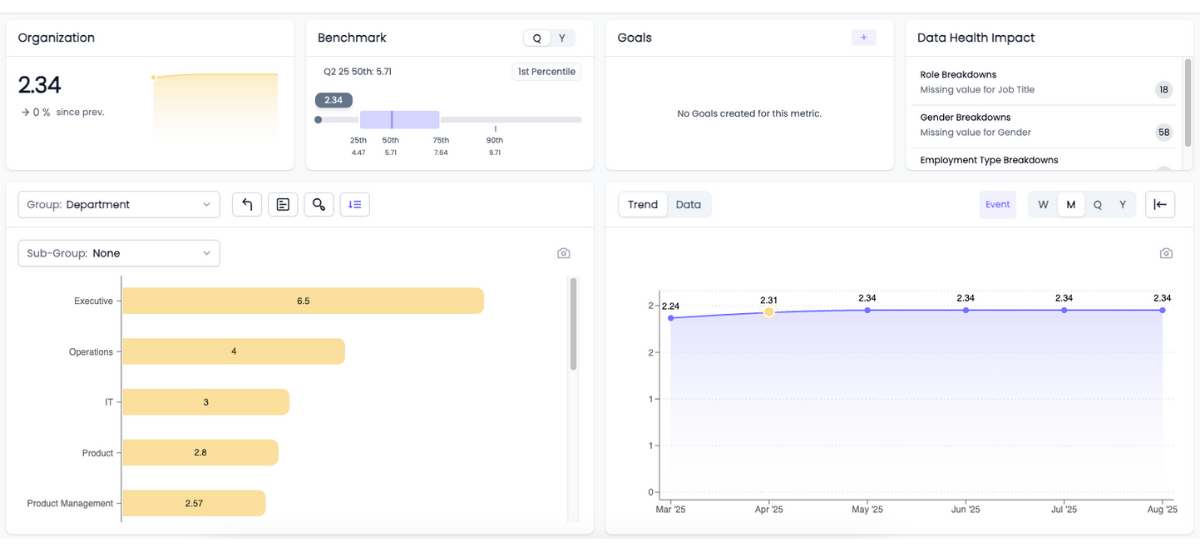
Industry benchmarks are included with every metric
Every metric includes benchmarking against your industry, company size, and region—so you can answer the question that always comes next:
“How do we compare?”
We handle the normalization, you get the insight.
 Schedule a demo
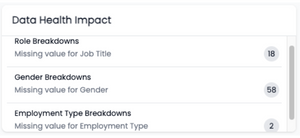
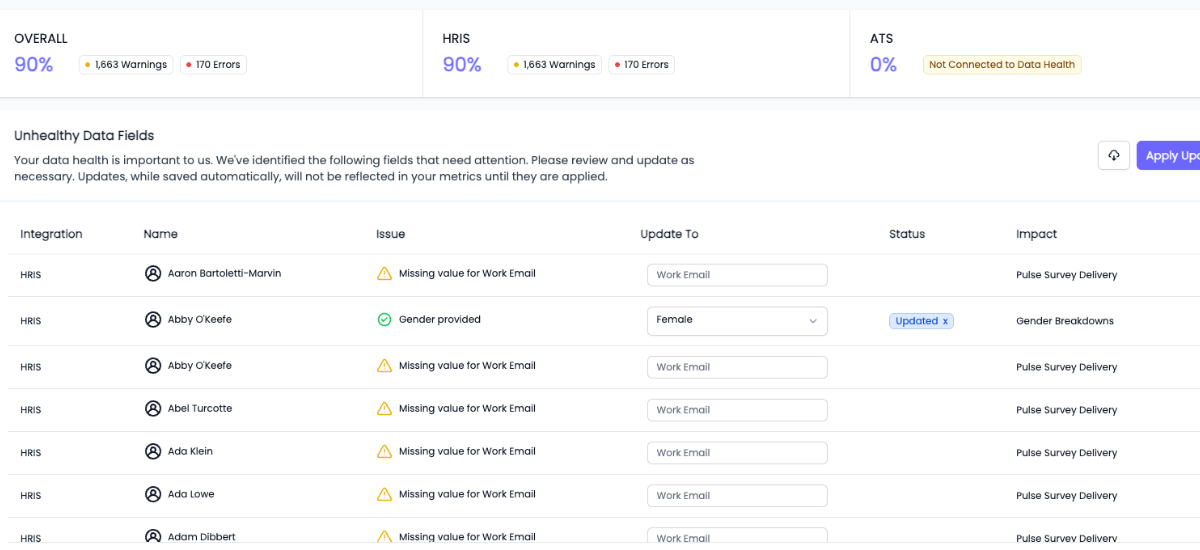
Built-in data health monitoring gives you confidence in your data
You can’t report what you can’t trust.
HRBench scans every metric for missing or incomplete data fields and highlights what needs attention—so your reports are always built on clean, complete data.
 Schedule a demo
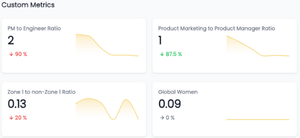
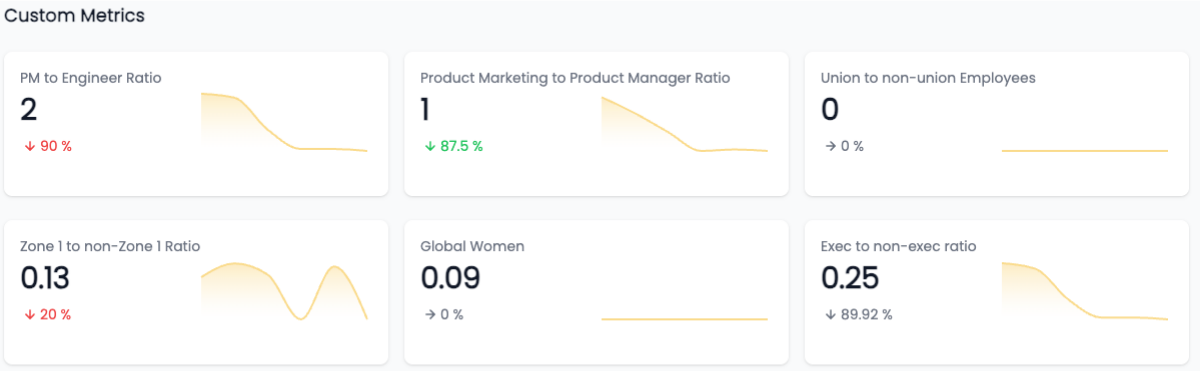
Custom metrics for anything you need to measure with no SQL required
Need to track something unique to your business?
We support fully custom metrics—built by our team, shown alongside our 45+ standard HR metrics, and filterable just like the rest.
No BI tool. No analysts. Just answers.
 Schedule a demo
From tactical tracking to strategic impact, HRBench is built for people teams
Most HR teams spend weeks pulling reports, cleaning spreadsheets, and stitching together dashboards across systems.
HRBench Analytics eliminates the manual work—so you can focus on driving action.
The conversations have changed from, ‘Here’s the data,’ to ‘I see the trend and the root cause.
.png)
Of my vendors, HRBench is the top of my list. We held onto trailing data from our prior system and integrated it seamlessly. Our team had to do zero lift.

“HRBench gave us confidence. We weren’t spending hours building dashboards anymore. We could focus on strategy, not reporting.”
.jpg)
Frequently Asked Questions
If you don't find the information you're looking for, please don't hesitate to contact us directly, and our team will be happy to assist you.
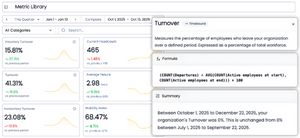
HRBench auto-calculates 45+ core HR metrics across six categories: headcount, diversity, retention, recruiting, employee movement, and organizational costs. Metrics include turnover rate, span of control, retention rate, revenue per employee, and more. All metrics begin calculating the moment your data is connected, with no manual formulas or configuration required.
Yes. Every metric in HRBench is fully drillable. You can click into any metric tile to explore historical trends, department-level breakdowns, and benchmark comparisons. You can also filter by role, gender, employment type, team, location, or tenure band to tell a more detailed story with your data.
Every metric in HRBench includes benchmark data so you can compare your workforce performance against similar organizations. Benchmarks are normalized by industry, company size, and region. HRBench handles the normalization automatically so you can answer the question executives always ask: how do we compare?
Data health monitoring scans every metric for missing or incomplete data fields and highlights what needs attention. This ensures your reports are always built on clean, complete data before they reach leadership. You can also generate audit reports to share with your HR team for resolution.
No. HRBench supports fully custom metrics that are built by the HRBench team based on your goals and tech stack. Custom metrics appear alongside the 45+ standard metrics and are filterable just like the rest. No BI tools, no SQL, and no dedicated analysts required.
Power BI and Tableau are general-purpose BI tools that require significant setup, technical expertise, and ongoing maintenance to produce HR reports. HRBench is purpose-built for HR teams. Metrics calculate automatically from day one, benchmarks are included with every metric, and dashboards can be shared with leaders without additional licensing, training, or analyst headcount.
See your workforce data in 20 minutes
Book a personalized walkthrough and get a custom benchmark report built from your own headcount, turnover, and cost data. You'll leave the call knowing exactly what HRBench can surface from your HRIS, ATS, and engagement systems.
- A live walkthrough mapped to your company size, industry, and systems
- A custom benchmark report comparing your metrics to peer companies
- A clear view of what an HRBench rollout would look like for your team