ChartHop manages your people ops. HRBench answers leadership questions.
ChartHop is a solid people operations platform for org charts, compensation, and headcount planning. But when the board asks about turnover trends, workforce benchmarks, or flight risk, ChartHop doesn't have the answer. HRBench gives you 45+ auto-calculated metrics, industry benchmarks, and predictive analytics in under a week.
Trusted by HR leaders at:

Where ChartHop Falls Short on People Analytics
How HRBench Outperforms ChartHop for Analytics
HRBench fills the analytics gap that ChartHop doesn't address — giving HR leaders the metrics, benchmarks, and predictions they need to drive strategy, not just manage operations.
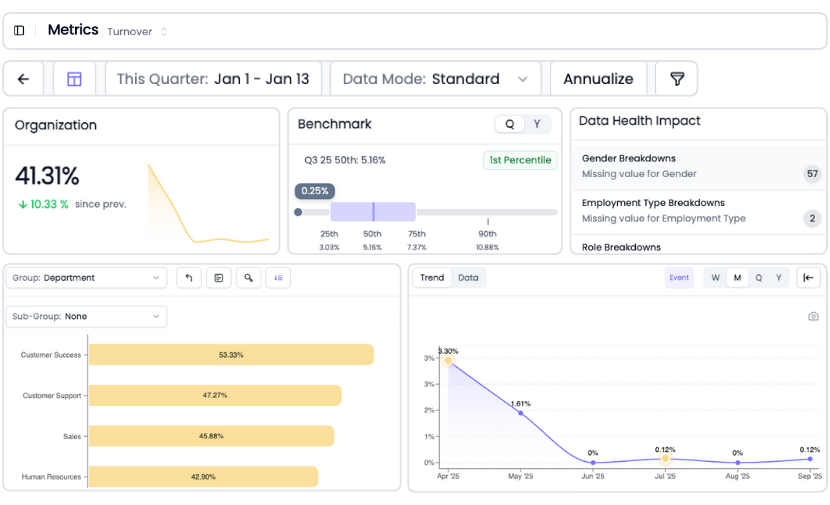
45+ auto-calculated HR metrics making your data instantly actionable.
ChartHop provides dashboards and reporting, but it is not a dedicated analytics engine. Building workforce reports in ChartHop requires manual configuration, and the platform lacks the depth of pre-built HR metrics that leadership expects.
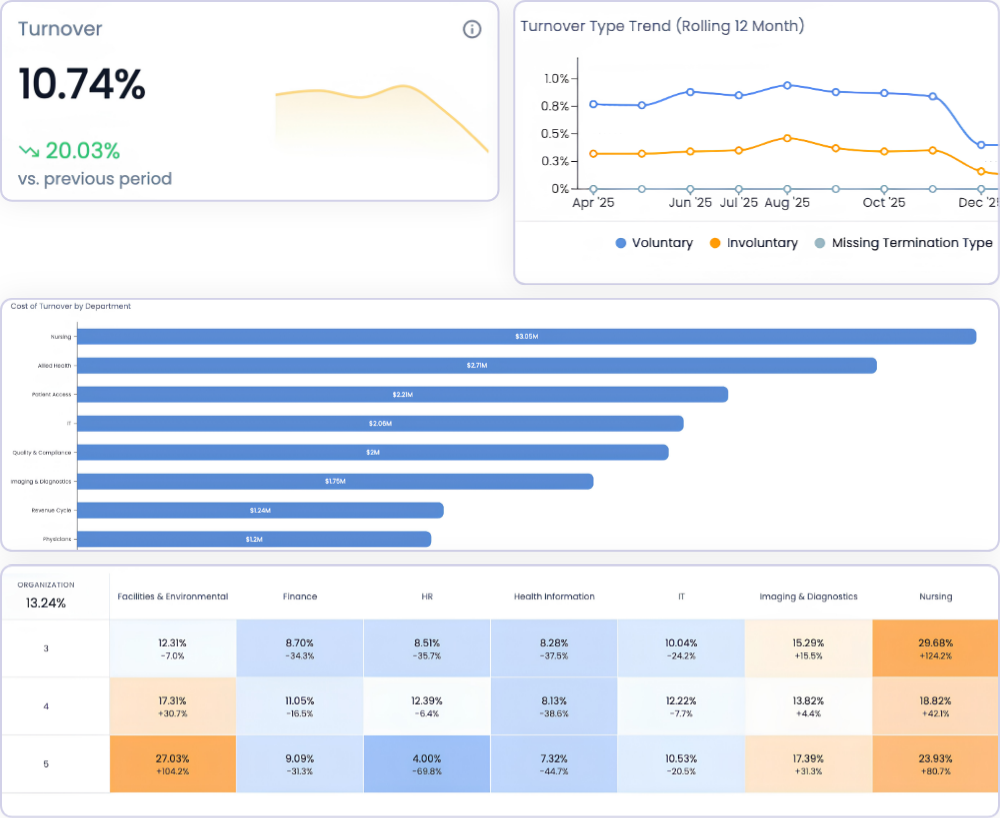
HRBench auto-calculates 45+ workforce metrics the moment your data connects. Headcount, turnover, span of control, revenue per employee, cost of turnover, retention rate. Every metric is drillable by department, role, gender, tenure, and more.
No report builder. No query language. Just answers.
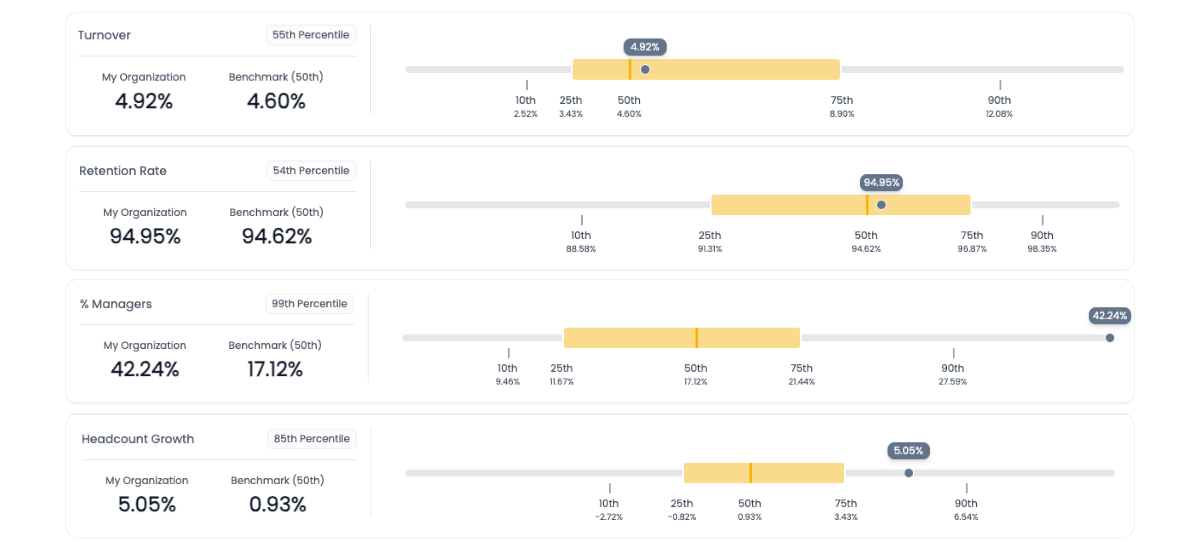
Industry benchmarks included with every metric so you know where you stand
This is the most critical gap between ChartHop and HRBench. ChartHop does not offer external workforce benchmarking. Period.
When leadership asks "how does our turnover compare to the industry?" or "is our span of control normal for our size?" — ChartHop has no answer. You're reporting internal numbers without external context.
HRBench embeds benchmarking against your industry, company size, and region inside every metric. Turnover at 4.92% against a 4.60% benchmark at the 55th percentile. Retention at 94.95% against 94.62% at the 54th percentile. Context that transforms internal data into strategic insight.
Know what's coming before it happens, predictive analytics ChartHop can't offer
ChartHop offers scenario planning for headcount. That's useful for budgeting: "what if we hire 10 engineers in Q3?" But scenario planning is reactive — you're modeling decisions you've already considered.
HRBench's predictive analytics forecast what's going to happen whether you act or not. 25+ workforce metrics forecasted 3 to 6 months out, including departures, turnover, new hire turnover, retention rate, span of control, and headcount growth. Sort by positive, negative, or neutral impact to focus on what needs attention.
ML-powered flight risk identification flags employees likely to leave with 85% accuracy — so you can intervene before you're backfilling the role.
ChartHop can't tell you who's about to leave. HRBench can.

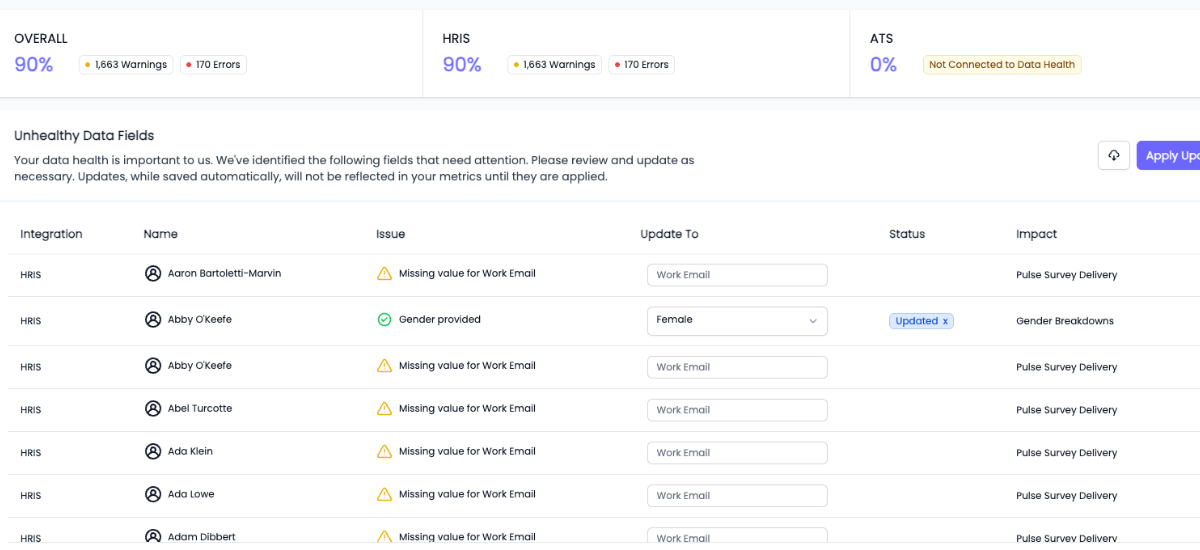
Built-in data health monitoring, so you're confident with clean, validated data
You can't report what you can't trust.
HRBench scans every metric for missing or incomplete data fields and highlights what needs attention, so your reports are always built on clean, complete data.
ChartHop users report that data sync failures can go unnoticed, and the platform lacks proactive monitoring or alerts when data quality degrades. G2 reviewers have requested better guardrails around data issues. If something is wrong upstream in ChartHop, you find out when the numbers don't add up in a board presentation. HRBench catches it before it reaches a dashboard.
Engagement surveys included and connected to your workforce analytics
ChartHop offers engagement surveys as a separate $4 PEPM add-on module with basic sentiment surveys, AI summaries, and anonymous feedback. It's a capable feature within the ChartHop ecosystem.
But here's the difference: ChartHop's survey data lives in a people ops platform with basic reporting. HRBench includes eNPS, pulse surveys, full engagement surveys, and exit interviews for every customer — and that survey data flows directly into your 45+ workforce metrics, benchmarks, and predictive analytics.
The correlation between engagement scores and turnover trends, between eNPS drops and flight risk, between survey sentiment and retention — that's where the value is. HRBench connects the dots. ChartHop keeps them in separate dashboards.

People ops and people analytics are different problems — here's how to think about it
ChartHop and HRBench are not direct competitors in the traditional sense. They solve different problems.
ChartHop excels at people operations: managing your org chart, running compensation cycles, conducting performance reviews, planning headcount, and serving as a lightweight HRIS. If you need a modern, intuitive platform to manage day-to-day HR operations — ChartHop is a strong choice. Their org chart visualization is best-in-class, and their UI is consistently praised in reviews.
HRBench excels at people analytics: auto-calculating workforce metrics, benchmarking against industry peers, forecasting turnover and retention, identifying flight risk, and delivering board-ready insights. If your leadership team is asking questions about workforce trends, costs, and competitive positioning — HRBench is where those answers live.
Many organizations need both. Some use ChartHop for ops and HRBench for analytics. Others consolidate onto HRBench because the analytics is what leadership actually measures them on.
AI-powered workforce answers, built for your team
Both HRBench and ChartHop offer AI assistants for natural language questions.
ChartHop's Ask ChartHop is a conversational AI copilot built across all ChartHop modules — HRIS, compensation, performance, engagement, and planning. It leverages their Access Guard system to ensure users only see data they're authorized to view. It's useful for navigating ChartHop's feature set and surfacing information from across the platform.
HRBie is HRBench's AI assistant built for workforce analytics. Ask natural language questions about your workforce data and get instant answers, visualizations, and trend analysis across 45+ auto-calculated metrics, benchmarks, and predictive forecasts. No query builder or technical knowledge needed.
The difference: Ask ChartHop helps you navigate a people ops platform. HRBie answers the workforce questions your leadership is actually asking — backed by metrics, benchmarks, and predictions that ChartHop doesn't have.

From tactical tracking to strategic impact, HRBench is built for people teams
Most HR teams spend weeks pulling reports, cleaning spreadsheets, and stitching together dashboards across systems.
ChartHop helps manage the operational side of HR. HRBench eliminates the analytics manual work, so you can focus on driving action — with the metrics, benchmarks, and predictions your leadership team needs to make better decisions.
The conversations have changed from, ‘Here’s the data,’ to ‘I see the trend and the root cause.
.png)
Of my vendors, HRBench is the top of my list. We held onto trailing data from our prior system and integrated it seamlessly. Our team had to do zero lift.

“HRBench gave us confidence. We weren’t spending hours building dashboards anymore. We could focus on strategy, not reporting.”
.jpg)
Frequently Asked Questions
Common questions from HR teams comparing Visier and HRBench.
Not necessarily. ChartHop and HRBench solve different problems. ChartHop is a people operations platform — it manages your org chart, compensation cycles, performance reviews, and headcount planning. HRBench is a dedicated people analytics platform — it auto-calculates workforce metrics, benchmarks against industry peers, and predicts turnover and flight risk. Some organizations use both: ChartHop for day-to-day people ops and HRBench for the analytics their leadership team needs. Others choose HRBench because the analytics and benchmarking is what they're measured on. It depends on whether your primary gap is managing operations or answering strategic workforce questions.
HRBench integrates with 90+ HRIS and ATS platforms through pre-built APIs, including Workday, UKG, BambooHR, ADP, Paylocity, and more. If ChartHop is your system of record, HRBench can work alongside it — pulling the people data it needs to power analytics, benchmarks, and predictions.
No. ChartHop does not offer external workforce benchmarking. There is no way to compare your metrics against industry peers, company size cohorts, or regional averages within ChartHop. HRBench includes benchmarks for every metric — by industry, company size, and region — from day one. When leadership asks "how do we compare?" the answer is in the same view as your data.
ChartHop offers headcount scenario planning — modeling "what if" questions about organizational changes. This is useful for budgeting and workforce planning. However, ChartHop does not offer predictive workforce analytics. It cannot forecast turnover, predict retention trends, or identify employees at risk of leaving. HRBench forecasts 25+ workforce metrics 3 to 6 months out and includes ML-powered flight risk identification with 85% accuracy.
ChartHop uses transparent modular pricing: $8 per employee per month for the first module, $4 PEPM for each additional module, with a $9,000/year minimum. A company using all six modules (HRIS, headcount planning, compensation, performance, engagement, goals) would pay $28 PEPM. Implementation fees are scoped separately. HRBench offers transparent mid-market pricing with engagement surveys, benchmarks, predictive analytics, and org charts included for every customer. No modular add-on pricing — everything is included.
ChartHop has genuine strengths that HRBench doesn't replicate. ChartHop offers best-in-class org chart visualization, built-in compensation cycle management, performance reviews with 360-degree feedback, and can serve as your HRIS system of record. Their UI is consistently praised in reviews as intuitive and modern. If your primary need is managing day-to-day people operations — not workforce analytics — ChartHop is a strong choice.
ChartHop is best for growth-stage companies with 100 to 1,000 employees who need a modern, all-in-one people operations platform. If you're moving from spreadsheets to your first real HR platform and want org charts, compensation planning, performance management, and headcount planning in one place — ChartHop is a strong option. CFO and Finance teams particularly appreciate ChartHop's connection between people planning and budgets.
HRBench is built for mid-market and PE-backed companies with 500 to 5,000 employees who need trusted workforce analytics without hiring a dedicated analytics team. If your leadership team is asking for turnover trends, industry benchmarks, flight risk data, and board-ready workforce reports — and they needed the answers yesterday — HRBench is the right fit.
Both platforms offer fast implementation. ChartHop provides Day 1 org chart visibility once data is connected. HRBench customers go live in under 7 days, with some launching in as little as 24 hours — with metrics auto-calculated and benchmarks populated immediately.
See your workforce data in 20 minutes
Book a personalized walkthrough and get a custom benchmark report built from your own headcount, turnover, and cost data. You'll leave the call knowing exactly what HRBench can surface from your HRIS, ATS, and engagement systems.
- A live walkthrough mapped to your company size, industry, and systems
- A custom benchmark report comparing your metrics to peer companies
- A clear view of what an HRBench rollout would look like for your team