

Your operating partner asked for a workforce value creation dashboard. Headcount efficiency by site. Cost per FTE trend. Turnover cost mapped to the value creation plan. You have fragments of this in a spreadsheet somewhere. That is the problem.
PE firms have figured this out. Most portfolio company CHROs haven't.
Private equity has spent the last five years building internal people capability at a pace most HR leaders haven't registered. Russell Reynolds found that 77% of dedicated talent professionals at PE firms were appointed in the last five years. Half were hired in the last three. The Christopher Group estimates CHRO presence at portfolio companies rose from near zero to over 50% since 2018.
The sponsors are investing because they've done the math. Workforce costs consume roughly 70% of portfolio company operating budgets, per Bureau of Labor Statistics data. For a mid-market manufacturer running $200M in revenue, that's $140M in annual workforce spend. At a 10x exit multiple, every $1M in workforce cost misallocation erases $10M in enterprise value. The largest line on the P&L is also the most consequential for exit pricing.
And the PE-backed workforce is growing fast. Middle market portfolio companies grew employment 9.0% year-over-year between July 2024 and July 2025, while the broader U.S. economy grew 1.2%. Nearly two in five portfolio companies grew headcount by double digits. All of that growth requires workforce planning. Most of it doesn't get any.
The uncomfortable part: the most-cited frameworks for evaluating value creation plans don't include a workforce planning test. CVC published its "Ten Tests of a World-Class PE Value Creation Plan" in 2026, covering thesis clarity, leadership fit, execution capacity, and the mechanics of building an "execution machine." Workforce planning is not one of the ten tests. FTI Consulting surveyed 500+ PE decision-makers for its 2025 Value Creation Index and ranked ten value creation levers by priority and effectiveness. Technology and IT ranked first. M&A ranked last. Workforce planning didn't make the list.
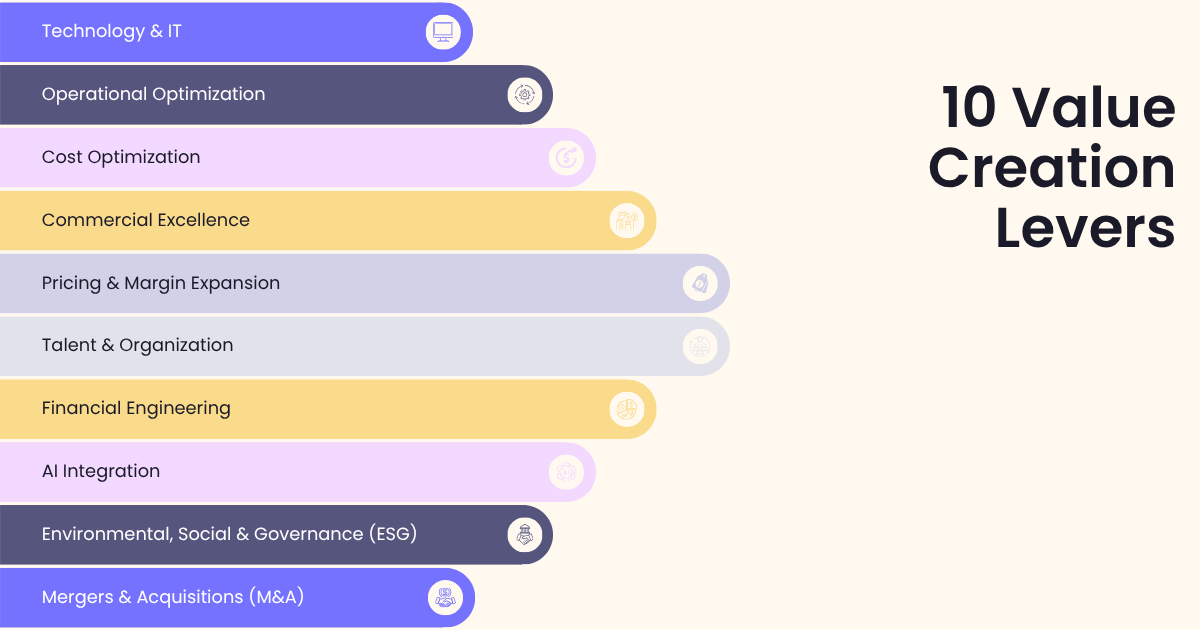
Sponsors know workforce is the largest cost on the P&L. They're placing CHROs and hiring talent professionals at record rates. But the formal frameworks they use to evaluate value creation still treat workforce planning as someone else's problem. That gap, between what sponsors expect and what they formally measure, is where portco CHROs get stuck. Your sponsor believes workforce planning matters. They haven't built the reporting structure for it yet. Whoever builds it first controls the conversation.
Three numbers your board wants that your spreadsheet can't produce
When your operating partner asks for workforce data, they want financial intelligence about the largest cost center in the business. How workforce decisions are affecting the investment thesis, and whether those decisions are working.
Three metrics bridge the gap between what HR tracks and what the board needs to evaluate value creation.
Revenue per employee is the productivity signal. It tells the board whether the company is scaling efficiently or whether headcount is outpacing value. PE-backed middle market companies grew employment 9.0% year-over-year between 2024 and 2025. But headcount growth without proportional revenue growth is dilution, not execution. If your company added 250 people last year and revenue per employee declined, the VCP has a workforce efficiency problem the board can see, even if HR hasn't named it yet. This metric, benchmarked against industry peers and trended against VCP milestones, is the first number that belongs on that dashboard your operating partner requested.
Cost of turnover is the cash leak most boards never quantify. Replacing a single manufacturing floor supervisor costs $30,000 to $50,000 when you include recruiting, training, overtime coverage, and the productivity ramp for the replacement. HRBench benchmark data shows mid-market manufacturing companies (1,000 to 3,000 employees) carry a median annual turnover rate of 24.8%. For a 2,800-person manufacturer, that translates to roughly 690 separations per year. At a conservative $35,000 per separation, the annual cost is $24M. Most of that number never appears on a board slide because nobody calculates it. A 5-point reduction in turnover rate, from the 50th percentile to roughly the 25th, saves approximately $6M per year. At a 10x exit multiple, that is $60M in enterprise value. Created by a workforce planning decision.
Headcount plan vs. actual is the execution discipline metric. IQ Talent reports that 68% of PE portfolio companies miss first-year headcount targets by 25% or more. Every unfilled position carries an estimated cost of vacancy between $4,000 and $6,000 per month. Every unplanned addition strains the budget and the team absorbing them. The gap between what the workforce plan projected and what happened tells the board whether HR is executing against the thesis or reacting to events. Operating partners watch this number the same way they watch revenue vs. forecast. Consistent misses don't get blamed on the market. They get traced to the plan.
These are financial metrics that live in HR's systems. The CHRO who can produce them, benchmark them against industry and size peers, and trend them quarter over quarter against VCP milestones becomes the most data-credible leader in the operating review.
What PE-grade workforce planning looks like
The gap between what most portco CHROs deliver and what their sponsors need is infrastructure, not intent. Most PE-backed HR leaders do workforce planning. They do it in a spreadsheet, once a year, disconnected from the financial model. The intent is there. The infrastructure isn't.
PE-grade workforce planning differs in three specific ways.
It's scenario-based. A static headcount forecast breaks the first time the thesis shifts, which in PE happens roughly every quarter. Scenario modeling lets the CHRO present three workforce plans tied to the three revenue scenarios the CFO already built. When the board asks what happens to loaded workforce cost if the Dallas expansion accelerates by six months, the answer should take minutes, not weeks. The organizations getting this right maintain version-controlled workforce plans that update as assumptions change. They stopped building annual decks that expire on delivery.
It's cost-integrated. Every headcount change carries a fully loaded cost impact: salary, benefits, recruiting cost, training investment, productivity ramp time. The CFO models this level of detail for capital expenditures. The CHRO should model it for workforce expenditures with the same rigor. When the planning tool calculates cost impact in real time as positions are added, reassigned, or eliminated, the CHRO and CFO start working from the same numbers. That alignment is what the operating partner is requesting when they ask for a "workforce value creation dashboard." They want HR and finance speaking the same language about the same line item.
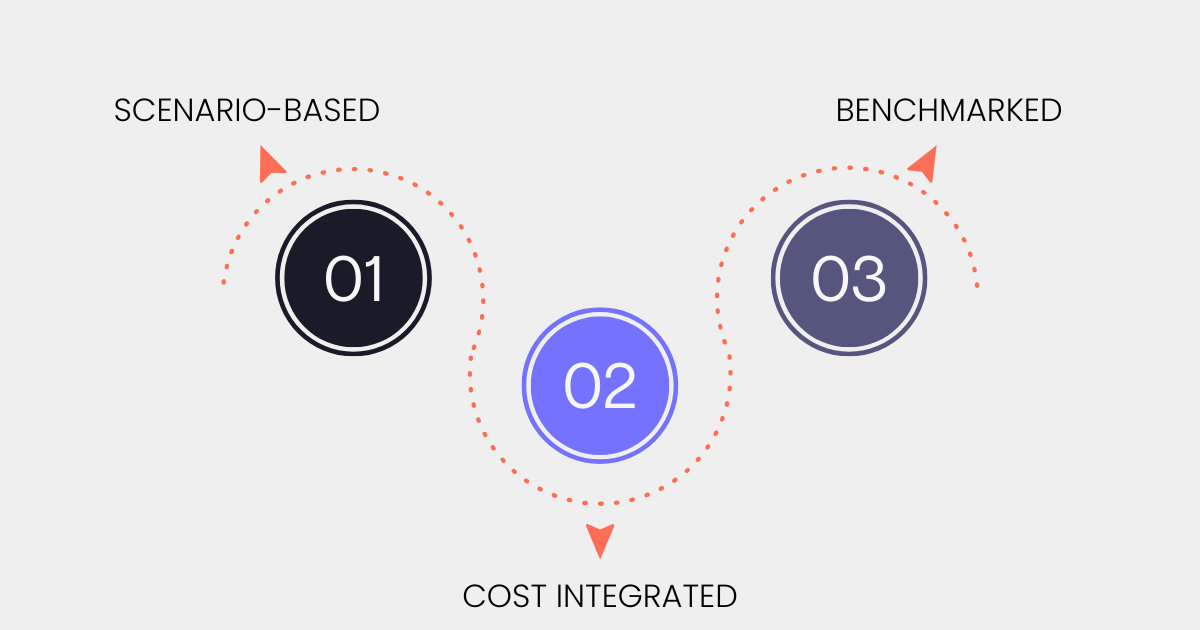
It's benchmarked. A 24.8% turnover rate means nothing to a board without context. Is that 25th percentile for mid-market manufacturers, or 75th? Is the company's stability index improving quarter over quarter, or declining? Benchmark data segmented by industry, company size, and region turns workforce reporting from internal scorekeeping into competitive intelligence. The operating partner who requested that dashboard wants to know how this portco compares to the rest of the portfolio and to external peers. Internal numbers without external benchmarks are data, not insight.
The CHRO who delivers scenario-based, cost-integrated, benchmarked workforce planning doesn't answer the operating partner's request. They change what gets asked next.
The ask for a workforce value creation dashboard is the beginning of a reporting expectation that will follow PE-backed CHROs for the rest of this investment cycle. The CHROs who build the infrastructure to meet it will earn a seat in the value creation conversation. The ones who send a spreadsheet will find their sponsor building the dashboard without them.
