Cost of Turnover Calculator: Estimate Your Annual Workforce Spend
For HR leaders and finance teams who need to quantify the true cost of employee turnover, see how your number compares to industry peers, and make the case for retention investment.
Calculate now ↓What Is the Cost of Turnover?
The cost of turnover is the total financial impact an organization absorbs when an employee leaves. It goes well beyond the recruiting budget.
Every departure triggers a chain of expenses: separation processing, the productivity gap while the role sits open, sourcing and screening costs to find a replacement, onboarding and training for the new hire, and reduced output while that person ramps up. Most organizations underestimate this number because the costs are spread across departments. Recruiting spend shows up in HR. The productivity gap shows up in operations. Manager time spent interviewing candidates shows up nowhere.
None of these appear as a single line item in the budget, so the true cost stays invisible until someone adds it up.
Calculating it directly translates headcount churn into a dollar figure your CFO, board, or PE sponsor can evaluate alongside other operational KPIs. For frontline-heavy organizations where voluntary turnover often exceeds 20% annually, the cumulative figure can rival or exceed the annual HR budget.
Why the Cost of Turnover Matters for Your Organization
The U.S. economy loses an estimated $1 trillion annually to voluntary employee turnover, according to Gallup. At the individual company level, that translates into a predictable drag on profitability that most organizations are not actively measuring.
Here is what the cost of turnover affects directly.
EBITDA and operating margins. Every departure increases labor costs without a corresponding revenue gain. For PE-backed companies where EBITDA margins drive valuation multiples, uncontrolled turnover compresses enterprise value.
Management bandwidth. Managers spend an average of 17% of their time on hiring-related activities during an open vacancy. That is time not spent on coaching, operations, or revenue-driving work.
Remaining team performance. After a departure, engaged team members absorb a significant share of the leaving employee's workload while maintaining their own responsibilities. Gallup research links high turnover environments to measurable declines in team engagement and output before a replacement is hired.
Recruiting cost escalation. Organizations with chronic high turnover pay above-market fees as urgency increases. External agencies charge 15-25% of first-year salary. Repeat departures in the same role compound the expense every cycle.
Tracking this number moves turnover from an HR metric into a P&L input executives can act on.
How to Calculate the Cost of Turnover
The cost of a single departure has four components.
Step 1: Recruiting cost
This is the direct spend to fill the role: job postings, recruiter time, agency fees if applicable, and interview coordination. The standard estimate is 30% of the departing employee's annual salary, though this varies by role seniority and sourcing method.
Step 2: Lost productivity during the vacancy
While the role sits open, output is partially covered by teammates or temporary resources. A conservative model uses 50% of the departing employee's daily salary rate multiplied by the number of days to fill the role. Average time to fill runs 42 days across industries, according to SHRM.
Step 3: Ramp-up cost
A new hire does not reach full productivity on day one. Research from Harvard Business Review suggests it takes 6-12 months to reach full effectiveness in complex roles. A reasonable estimate applies 25% of daily salary rate across a 90-day ramp-up period.
Step 4: Training cost
Formal onboarding, system access, and role-specific development add approximately 10% of annual salary, according to ATD research on employer training spend.
To illustrate: a PE-backed healthcare services company with 600 employees, an average salary of $72,000, and a voluntary turnover rate of 22% would experience 132 departures annually. With a cost per departure of approximately $41,000, the total annual turnover cost reaches $5.4 million. That figure appears in no budget line. It is absorbed silently across departments.
What a Typical Turnover Cost Looks Like
Cost per departure scales with salary and role complexity.
SHRM research puts the replacement cost for entry-level and hourly roles at 30-50% of annual salary. Mid-level professional and technical roles run 100-150%. Senior leaders and executives reach 150-200% or higher. The largest variable across all levels is indirect cost: lost productivity before and after the hire typically exceeds direct recruiting spend by 2-3x.
The other critical variable is the voluntary turnover rate itself. According to HRBench 2025 benchmark data from 690 organizations, the national median voluntary turnover rate is 21.5%. The 25th percentile sits at 14.2%, meaning the top quartile of retention-focused organizations lose fewer than 1 in 7 employees annually. The 75th percentile reaches 29.4%.
At a median turnover rate, a 500-person company paying $75,000 average salary faces annual turnover costs in the range of $3-8 million depending on how cost per departure is modeled. That range narrows when you use your own inputs rather than industry averages.
Internal trends matter more than external benchmarks. A number improving year over year, even if it starts above the median, signals that your retention programs are working.
How to Use Your Turnover Cost Results
Once you have a number, the question is what to do with it.
Share it with your executive team. Turnover cost is one of the clearest ways HR translates retention work into financial language. A $5 million annual turnover bill justifies a $500,000 retention program with a clear ROI calculation. Present it in the same meeting as revenue and margin data, not alongside engagement survey scores.
Use it to prioritize retention investment. Not all turnover is equal. Calculate cost per departure for your highest-salary and hardest-to-fill roles. That is where targeted spending on compensation adjustments, development programs, and stay interviews delivers the highest return.
Track it quarterly. Turnover cost changes as headcount, salary levels, and market conditions shift. A quarterly review shows whether retention investments are working before annual reviews provide the same signal.
Pair it with related metrics. Turnover cost alone does not explain the problem. Pair it with your voluntary turnover rate, eNPS, time to fill, and retention rate to identify root causes and measure progress over time.
Calculate Your Cost of Turnover
The HRBench Cost of Turnover Calculator outputs three immediate results from your headcount, average salary, and turnover rate: estimated annual departures, cost per departure, and cost as a percentage of total payroll. After submitting your information, you unlock a full industry benchmark comparison showing where your turnover rate falls against the 25th, 50th, and 75th percentile for your industry and company size, a component-level cost breakdown across recruiting, lost productivity, ramp-up, and training, a savings projection if your turnover rate reached the industry median, and a three-year cost outlook. Your results export to a branded PowerPoint slide built for executive and board presentations.
How HRBench tracks this
The calculator above gives you a snapshot. HRBench gives you the live picture.
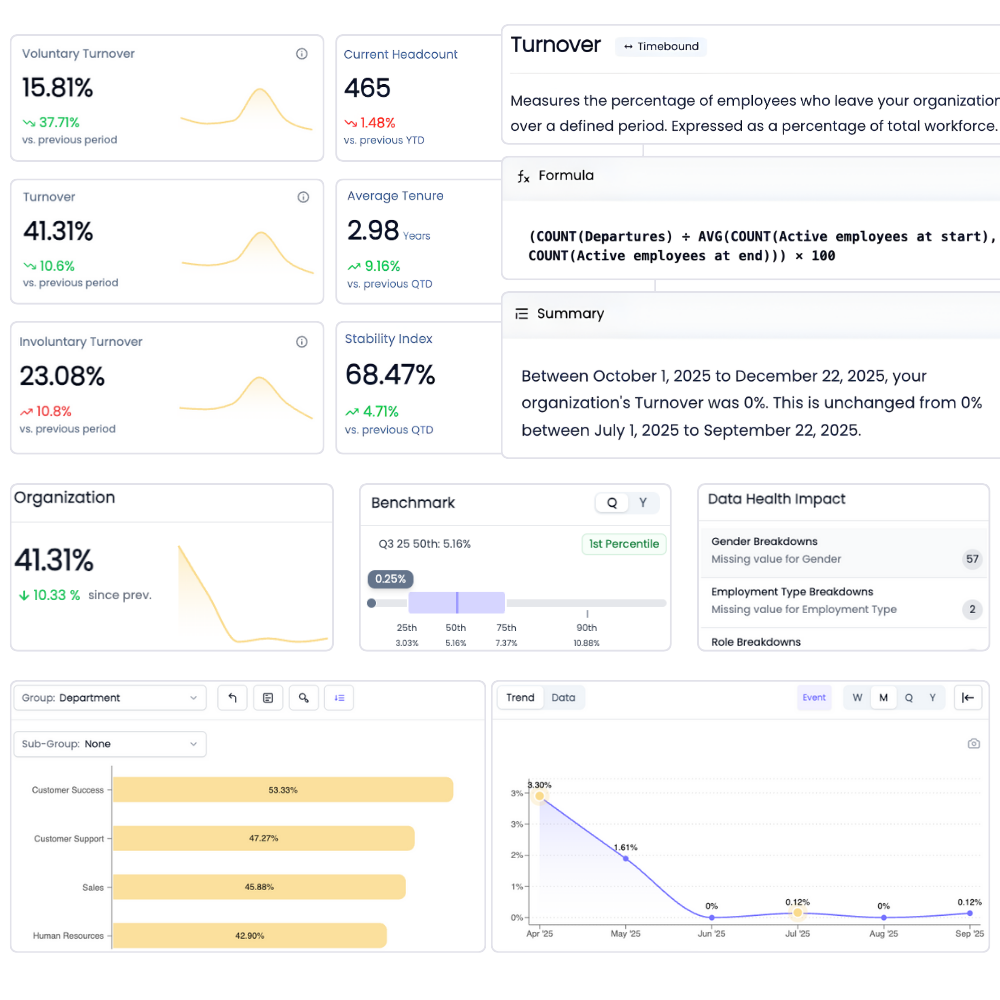
Inside HRBench, cost of turnover is not a one-time calculation. The platform pulls headcount, salary, and termination data from your HRIS daily and recalculates turnover cost automatically across every department, location, and manager. You can filter by voluntary vs. involuntary, isolate specific time periods, and layer in performance ratings to see what it costs when your top performers leave vs. your average performers.
Benchmark comparisons are built into every metric view. Your voluntary turnover rate sits next to the 25th, 50th, and 75th percentile for your industry and company size, so you always know where you stand without running a separate analysis. When turnover spikes after a bonus payout or a leadership change, logged events on the timeline explain why.
Predictive analytics take it further. HRBench forecasts departures, turnover rate, and new hire turnover out 3-6 months so you can build the business case for retention programs before the cost hits your P&L.
Related Resources


Frequently Asked Questions
If you don't find the information you're looking for, please don't hesitate to contact us directly, and our team will be happy to assist you.
The cost to replace an employee ranges from 30-50% of annual salary for entry-level hourly roles to 150-200% for senior professionals, according to SHRM research. The average across all roles is approximately 50-75% of annual salary when all direct and indirect costs are included. A common misconception is that recruiting fees represent most of the cost. In practice, indirect costs including lost productivity during the vacancy and reduced output during ramp-up represent 60-70% of the total. A $70,000 employee may cost $40,000-$100,000 to replace depending on seniority and how hard the role is to fill.
The full cost of employee turnover covers four categories: recruiting costs (job postings, agency fees, recruiter and manager time), lost productivity costs (the output gap while the role sits vacant), ramp-up costs (the reduced output from the new hire during their first 60-120 days), and training costs (formal onboarding and role-specific development). Many organizations also include separation processing and exit interview time. The largest category is usually lost productivity, not recruiting, though recruiting is the most visible line item. Organizations that track only hiring costs systematically undercount the true financial impact of voluntary attrition.
A good voluntary turnover rate depends on your industry and company size. According to HRBench 2025 benchmark data across 690 organizations, the national median voluntary turnover rate is 21.5%. The 25th percentile is 14.2%, meaning top-quartile retention organizations lose fewer than 1 in 7 employees annually. Hospitality, retail, and healthcare consistently see higher rates than professional services and financial services. Tracking your own rate quarter over quarter matters more than any external benchmark: a downward trend, even from a high starting point, indicates that retention investment is working.
The cost of hiring covers the expenses of sourcing, screening, and onboarding a new employee, typically 10-30% of annual salary. The cost of turnover is a broader calculation that also includes productivity losses that begin before the hire is made and continue for months after. Lost productivity during the vacancy period and the new hire's ramp-up to full effectiveness often exceed the direct recruiting spend by 2-3x. Calculating both separately gives a clearer picture of where money is actually going and which interventions offer the best return.
Roles with the highest cost per departure are those combining high base salary with long ramp-up times and hard-to-fill skill sets: senior engineers, clinical staff in healthcare, and specialized financial services roles. However, the highest aggregate annual cost often falls on frontline-heavy operations in hospitality, retail, and food service, where turnover rates of 40-60% at scale generate enormous total replacement costs even when salary-per-departure is lower. The product of turnover rate and cost per departure, applied across total headcount, determines where your organization's overall exposure is greatest.
See your workforce data in 20 minutes
Book a personalized walkthrough and get a custom benchmark report built from your own headcount, turnover, and cost data. You'll leave the call knowing exactly what HRBench can surface from your HRIS, ATS, and engagement systems.
- A live walkthrough mapped to your company size, industry, and systems
- A custom benchmark report comparing your metrics to peer companies
- A clear view of what an HRBench rollout would look like for your team