Dive deeper into any metric with a single click.
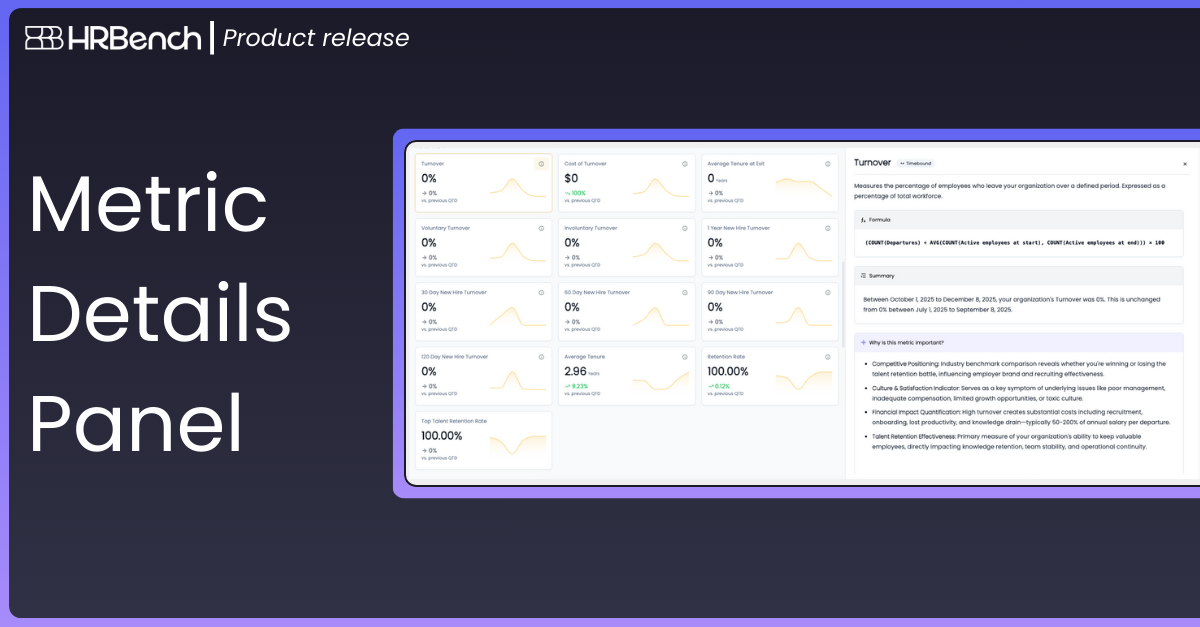
A single click now opens a more transparent, insight-rich view of each metric, giving users immediate access to the full story behind the data. This includes the metric description, formula, summary, importance, and impact.
This view clarifies how metrics are calculated, highlights movement based on your selected time period, and explains why each metric matters to the organization.
How It Works:
- Click the Information Icon on any metric card to open the Metric Detail Panel.
- View a clear breakdown of how the metric is calculated.
- Access an auto-generated Summary that interprets movement based on the date range and comparison window.
- Review the Why This Metric Is Important section, which outlines the strategic relevance of the metric.
Close the panel at any time to return to the full Metrics Library.