Put every HR metric into context with real-world HR benchmark data
HRBench includes HR benchmark data across all 45+ auto-calculated metrics, so you can see how your workforce compares by industry, size, region, and more.
Schedule demo
Trusted by HR leaders at:


All 45+ HR metrics come with a metric benchmark
HRBench calculates all of you HR metrics, but we don’t stop there. We show you how they compare. Every one of our 45+ metrics includes benchmark data by default, so you’re never presenting a number in isolation.
From Turnover Rate to Span of Control to Revenue per Employee, you’ll always know what good looks like.
 Schedule a demo
You can segment every metric benchmark
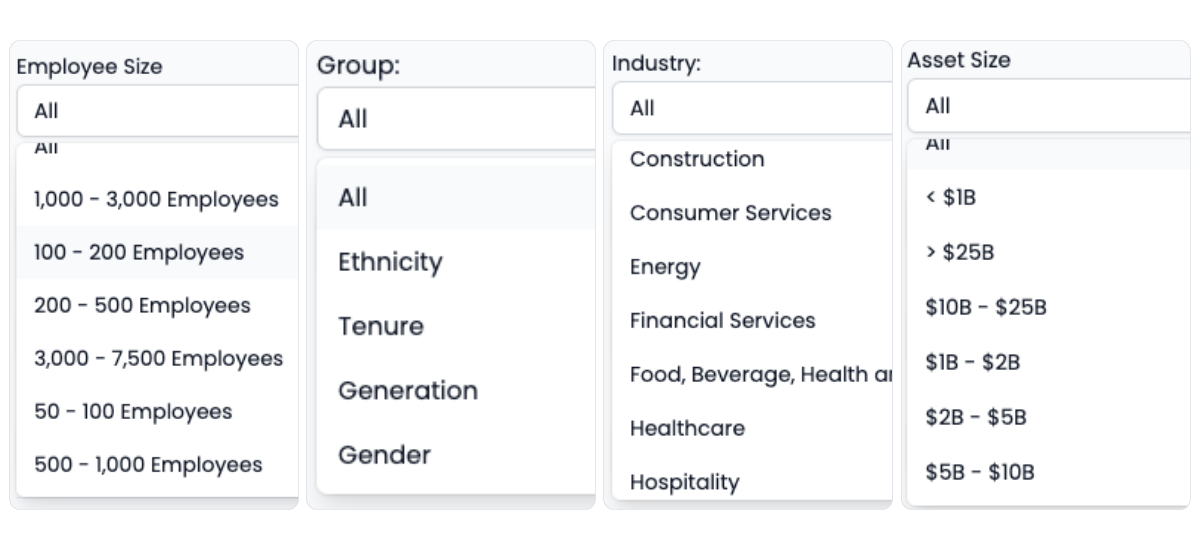
Segmenting benchmark data allows you to have a deeper understanding of your workforce data to help you make better decisions. HRBench benchmarks are segmented by:
Industry, Employee size, Company revenue (asset size), Region, Employee group (ethnicity, gender, tenure, generation)
This gives you context around your data to fit your organization.
 Schedule a demo
Benchmark data is built into every view inside HRBench
HRBench embeds benchmark data directly within each metric view. That means you don’t need extra tabs, no additional dashboards, and you can ask and answer questions inside each metrics view.
See your performance relative to your peer group. When you filter metrics, benchmarks update automatically in real time.
 Schedule a demo
All of your benchmark metrics in one view
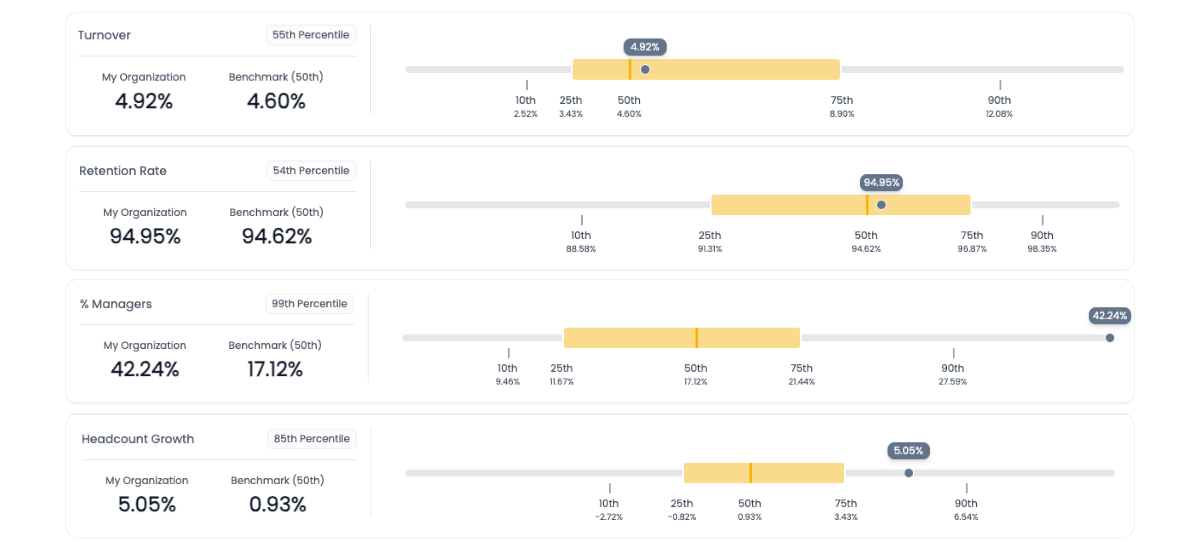
The Benchmark Overview tab gives you a side-by-side snapshot of all 45+ HRBench metrics and how your organization compares.
Quickly scan benchmark percentiles, see where you’re over- or under-performing, and identify areas for improvement—without clicking into individual metrics.
Perfect for board prep, strategy reviews, or understanding where to focus next.
 Schedule a demo
No spreadsheets. No data warehouse. No analyst or SQL required.
HRBench handles the normalization, the segmentation, and the math for every metric and their benchmark data point, so you can focus on insights and making decisions.
Everything is auto-calculated, filterable, and exportable to a board-ready presentation in seconds.
 Schedule a demo
Tell the right, contextual story to leadership every time you present data
When a member of your leadership team asks, “Is that good?” you’ll have a data-backed answer ready.
Benchmarking helps HR teams frame performance, set realistic targets, and guide the conversation from reactive reporting to strategic decision making.
The conversations have changed from, ‘Here’s the data,’ to ‘I see the trend and the root cause.
.png)
Of my vendors, HRBench is the top of my list. We held onto trailing data from our prior system and integrated it seamlessly. Our team had to do zero lift.

“HRBench gave us confidence. We weren’t spending hours building dashboards anymore. We could focus on strategy, not reporting.”
.jpg)
Frequently Asked Questions
If you don't find the information you're looking for, please don't hesitate to contact us directly, and our team will be happy to assist you.
25+ of HRBench's auto-calculated metrics includes benchmark data by default. This covers turnover rate, span of control, revenue per employee, retention rate, headcount growth, time to fill, and more. There are no add-on modules or separate purchases required to access benchmarks.
HRBench lets you segment benchmark data by industry, employee size, company revenue or asset size, region, and employee group. Employee group segments include ethnicity, gender, tenure, and generation. This gives you contextual comparisons that fit your specific organization rather than generic industry averages.
Benchmarks are embedded directly within each metric view in HRBench. You see them inline alongside your own performance data in every metric overview and drill-down view. There is also a Benchmark Overview tab that shows all 45+ metrics with their benchmark values in a single comparison view. Benchmarks update automatically when you apply filters.
Benchmark data is included by default for every HRBench customer across all 45+ metrics. There are no add-on modules, no CSVs to import, and no separate licensing fees. Benchmarks are available as soon as your data is connected.
Compensation benchmarks are widely available through paid and free services and focus on what to pay for specific roles and locations. HRBench provides workforce benchmarks covering operational HR metrics like turnover rate, time to fill, span of control, retention rate, and headcount growth. These workforce benchmarks are much harder to find externally and give HR leaders context for how their organization performs compared to peers.
Yes. HRBench handles the normalization, segmentation, and calculations for every benchmark data point. You can export benchmark comparisons to board-ready presentations in seconds. When leadership asks how your metrics compare, you have a data-backed answer ready without building anything manually.
See your workforce data in 20 minutes
Book a personalized walkthrough and get a custom benchmark report built from your own headcount, turnover, and cost data. You'll leave the call knowing exactly what HRBench can surface from your HRIS, ATS, and engagement systems.
- A live walkthrough mapped to your company size, industry, and systems
- A custom benchmark report comparing your metrics to peer companies
- A clear view of what an HRBench rollout would look like for your team