
Two companies report 18% annual turnover. Both present the number at their quarterly board meetings. Both get the same concerned nods from their directors.
But these companies have completely different problems. The first is losing five-year clinical veterans in a single department where a new manager took over in January. The second is hemorrhaging new hires within 90 days across every location because the onboarding program consists of a binder and a prayer.
Same number. Different root causes. Different solutions. The headline turnover rate hides both.
The Most Dangerous Number in Your Board Deck
Your annual turnover rate collapses every departure into a single percentage. A ten-year nurse who leaves for a competitor and a medical assistant who quits after six weeks count the same. A preventable resignation and an inevitable retirement carry equal weight. The number goes up. The board asks questions. HR scrambles.
Here's what the headline rate cannot tell you: who is leaving, when in their tenure they're leaving, why they're leaving, or how much each departure costs. It is a thermometer that tells you the patient has a fever without identifying whether the cause is an infection or a fracture.
Gallup's research found that 42% of employee turnover is preventable. But you can't prevent what you can't diagnose. And a single blended percentage across your entire organization is not a diagnosis. It's a symptom.
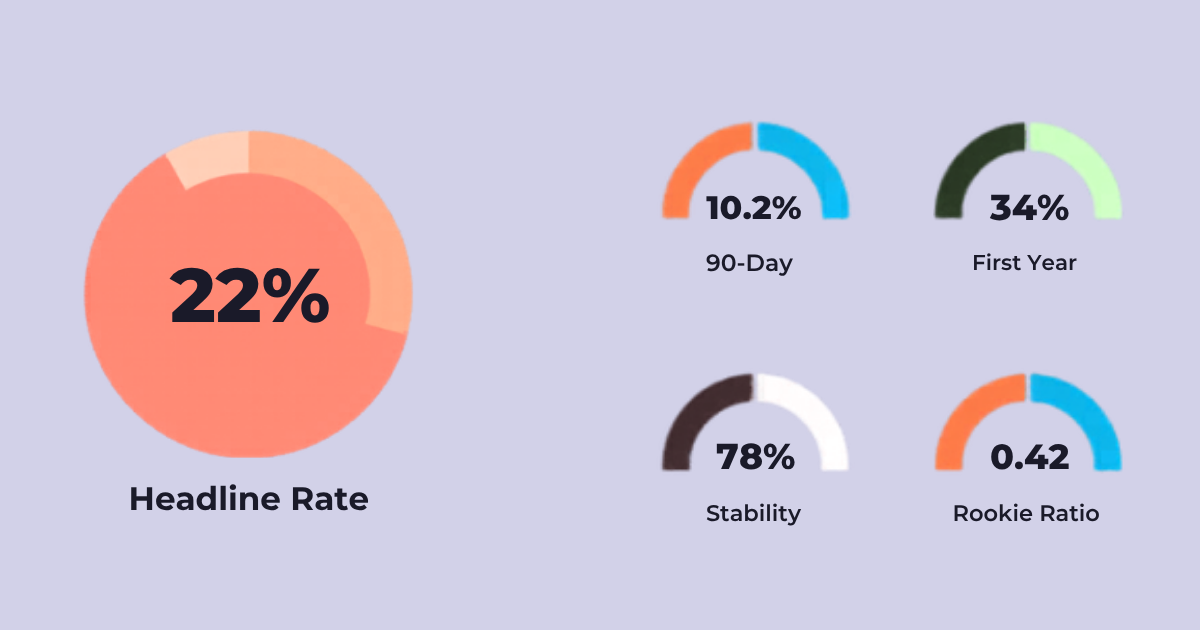
The problem compounds when the board fixates on it. "Our turnover is 22%. Last quarter it was 21%. What are we doing?" That question sounds reasonable. But answering it with a retention program aimed at the whole organization is like prescribing antibiotics for every patient who walks into the ER with a fever. Some will improve. Most won't. And you'll have no idea which intervention worked or why.
Your total turnover figure is a starting point. The breakdown is where the insight lives.
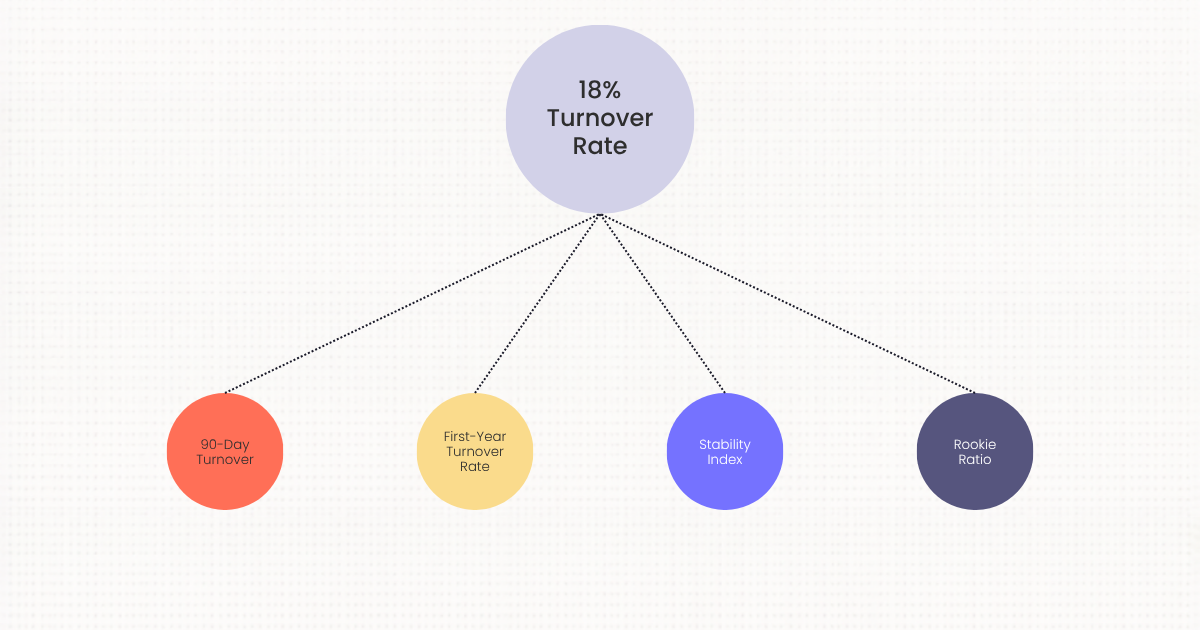
The Metrics That Diagnose the Problem
Four metrics break the headline rate into something you can act on. Few HRIS platforms calculate them automatically. So they go untracked.
90-Day New Hire Turnover measures the percentage of new hires who leave within their first three months. This is your onboarding signal. When this number is high, something is breaking between the offer letter and the third month on the job. Maybe it's expectation misalignment from the interview process. Maybe it's a manager who doesn't know how to onboard new team members. Maybe the role someone accepted doesn't match the role they showed up to do. Or maybe the work environment is different enough from what was described that new hires decide it's not worth staying to find out if things improve.
Across healthcare services companies with 1,000 to 5,000 employees, the median 90-day new hire turnover rate is 5.1%. If yours is double that, your onboarding process needs examination before you spend budget on retention bonuses for tenured staff.
First-Year Turnover Rate captures everyone who leaves before their one-year anniversary. Work Institute data shows that roughly 40% of all employee turnover happens within the first year. Four in ten departures are people who never made it twelve months.
If your headline rate is 20% and most of those exits are first-year employees, you don't have a retention problem. You have a hiring problem, an onboarding problem, or a culture-fit problem. The fix is upstream, not downstream.
Stability Index measures the percentage of employees who were present at the start of a period and remained through the end. Where turnover rate counts departures, Stability Index counts who stayed. The distinction matters more than it sounds.
A department with 15% turnover and 92% stability has a concentrated, manageable issue. A department with 15% turnover and 78% stability is losing people from across the entire team. Same headline rate. Completely different workforce realities. In the second scenario, institutional knowledge is draining faster than it can be replaced, even though the turnover number looks identical to the first.
In healthcare services companies with 1,000 to 3,000 employees, the median Stability Index sits around 88.6%. Below 80%, you're rebuilding your workforce faster than you can transfer knowledge.
Rookie Ratio is the proportion of employees with less than one year of tenure relative to total headcount. A high Rookie Ratio means your workforce skews inexperienced. In frontline-heavy industries like healthcare and manufacturing, this directly affects patient outcomes, production quality, and safety incident rates.
When the Rookie Ratio climbs above 0.40, more than four in ten of your employees are still learning the job. Pair that with a high 90-day turnover rate and the cycle becomes visible: you're investing in people who leave before they become productive, then replacing them with more people who leave before they become productive.
What Your Turnover Rate Is Costing You
This is where the headline rate becomes dangerous. And where your CFO needs to pay attention.
The cost of losing a new hire within 90 days is not the same as the cost of losing a five-year veteran. But the headline rate treats every departure as interchangeable. HR Dive reports the average cost per employee turnover at $45,236 in 2026. The NSI National Health Care Retention Report puts the average cost of a single RN departure at $60,090. Gallup estimates replacement costs between 0.5x and 2x annual salary depending on role level and specialization.
Now run the math on tenure cohorts instead of a blended rate.
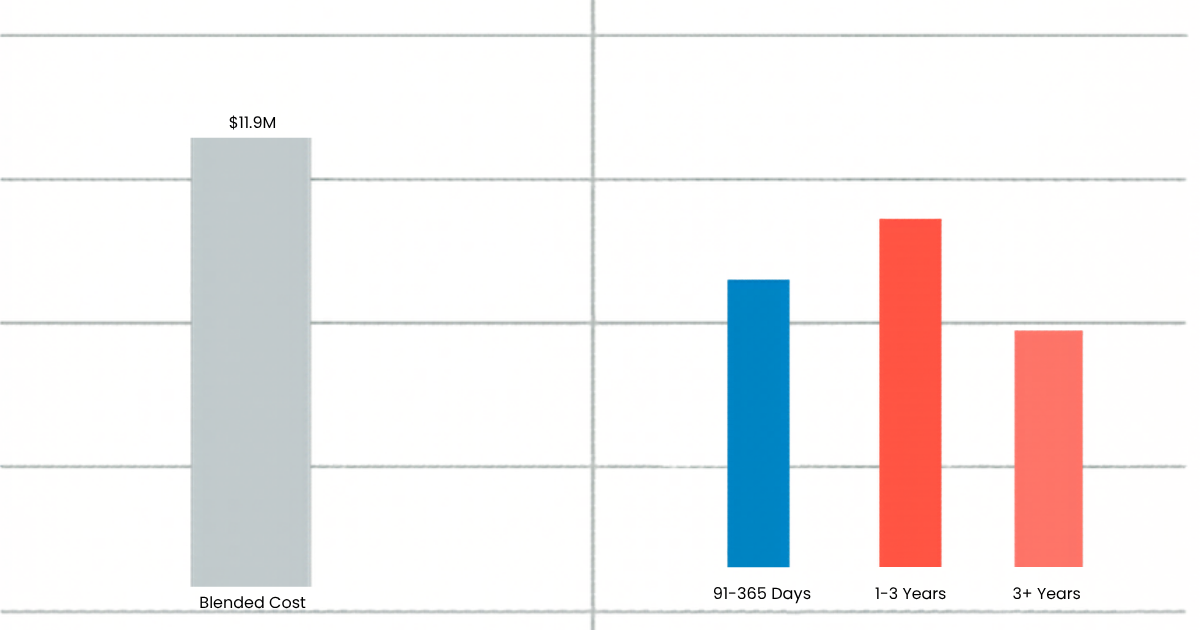
A 1,200-employee healthcare company reporting 22% annual turnover is losing roughly 264 employees per year. At $45,236 average cost, that's $11.9 million. That's the number that shows up in the board deck.
But segment those 264 departures by tenure. If 40% are first-year employees (matching the Work Institute benchmark), that's 106 people cycling through positions that never stabilize. You're paying recruiting, onboarding, and training costs repeatedly for the same roles. Those aren't departures. They're a revolving door. The remaining 158 departures across tenured employees carry a different cost profile: higher replacement difficulty, deeper knowledge loss, and months of operational disruption before each replacement reaches full productivity.
When you present the board with "$11.9M in turnover costs" they nod. When you present them with "$4.8M of that is concentrated in first-year clinical operations turnover driven by an onboarding gap that loses one in three new hires before their anniversary," they act. The second number has a cause, a location, and a fixable root.
Many HR practitioners we speak with report on turnover percentage and trend lines. Few report on the cost of turnover segmented by where in the employee lifecycle the loss is occurring. Finance doesn't respond to percentages. Finance responds to dollar figures attached to line items with identifiable causes.
Building the Diagnostic Framework
Moving from the headline rate to a turnover diagnostic takes four steps.
Segment by tenure cohort. Break departures into four groups: 0-90 days, 91-365 days, 1-3 years, and 3+ years. Each cohort reveals a different root cause. Early departures point to hiring or onboarding gaps. Mid-tenure departures suggest career development or management issues. Departures after three years often reflect compensation pressure or burnout, and they carry the highest institutional knowledge cost.
Layer in department and role level. A 22% company-wide rate might consist of 8% in corporate and 34% in clinical operations. The blended number masks the hotspot. The department at 34% needs a different intervention than the one at 8%, and a company-wide retention initiative will under-serve one and over-serve the other.
Calculate cost by cohort. Apply role-specific replacement costs to each tenure segment. A first-year medical assistant departure costs differently than a five-year charge nurse departure. When you separate these, the $11.9M headline number breaks into a cost map that points to specific decisions.
Benchmark against your industry. Internal trends tell you whether you're improving. External benchmarks tell you whether your numbers are normal or alarming. A 5% 90-day turnover rate is median for healthcare services companies your size. A 12% rate means something is broken that your peers have figured out. Without the external reference point, you're diagnosing in the dark.
Platforms like HRBench auto-calculate 90-day turnover, first-year turnover, Stability Index, Rookie Ratio, and cost of turnover, then benchmark each metric against industry, company size, and region. The math behind these metrics is not complicated. But doing it manually from an HRIS data export, for every tenure cohort, across every department, every quarter, is the reason the headline rate persists as the default.
The Real Story
Your board meeting is in two weeks. You can walk in with "our turnover rate is 22%" and absorb the same questions you absorbed last quarter.
Or you can walk in with "our first-year turnover in clinical operations is 34%, concentrated in three locations, costing us $1.8M annually. Here's the 90-day retention plan that addresses the root cause."
The headline rate tells the board something is wrong. The diagnostic framework tells them what to do about it. One gets a concerned nod. The other gets a budget.
