We’re excited to announce the launch of HRBench Insights, our newest Predictive Analytics tool designed to transform how you see your workforce.
Look Ahead with HRBench Insights
Project workforce trends 3 or 6 months into the future, everything from headcount shifts to retention trends, giving you a clear line of sight into what’s ahead.
From Reactive to Proactive
With this new capability, HRBench moves beyond reporting on what’s already happened. Now, you can:
- Anticipate workforce changes before they happen
- Make smarter, faster planning decisions
- Walk into board meetings with answers, not just updates
Smarter, Strategic Decisions
Go beyond static dashboards. HRBench Insights delivers forward-looking insights that empower you to guide workforce planning, manage risks, and show up prepared for boardroom conversations.

How it works
Turning Past Data into Future Insights
Forecasting in HRBench uses historical workforce data (turnover, headcount growth, hiring, etc.) to project what’s most likely to happen in the months ahead. This shifts people analytics from reporting the past to preparing for the future.
Predictive Analytics Methodology
- Learns from history: Identifies patterns such as seasonality (busy hiring months), long-term growth trends, and shifts in retention.
- Projects forward: Forecasts key workforce metrics, including turnover, headcount, and hiring needs, months in advance.
- Adjusts dynamically: Forecasts update automatically as new data flows in, ensuring the insights remain accurate and current.
How You Can Use It
- Turnover: Forecast the % of employees likely exit over the next 3 or 6 months.
- Span of Control: See how management layers may tighten or spread out.
- Headcount: Align staffing projections with business needs.
- Diversity Index: Forecast shifts in workforce diversity composition.
Why It Matters
- Proactive Planning: Move from reactive reporting to anticipating challenges.
- Flexibility: View a range of outcomes (best → worst case).
- Early Warnings: Spot unusual spikes or dips before they escalate.
- Strategic Alignment: Provide executives forward-looking insights for workforce planning, budgeting, and board reporting.
What You’ll See in HRBench
- Trend Line: Last 12 months.
- Forecast Value: Projected horizon.
- Trend Direction: Indicators of whether a metric is increasing, decreasing, or stable.
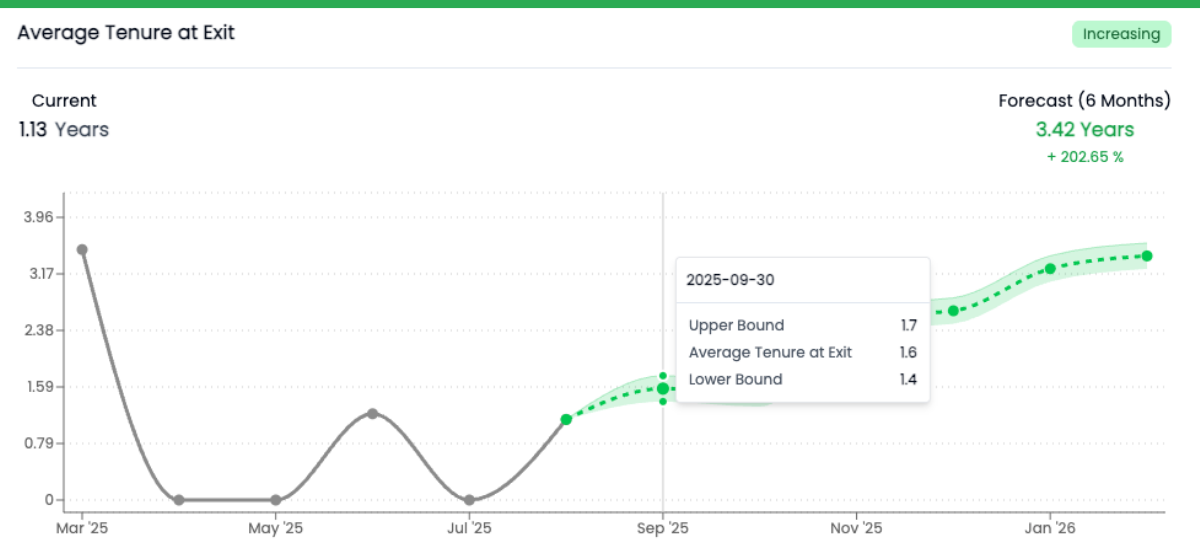
- Confidence Interval: Indicates both the most likely outcome and the range of realistic possibilities based on historical patterns.
Example in Action: Average Tenure Forecast
- Learns from history: Identifies tenure patterns across 24 months.
- Projects forward: Tenure is forecast to grow from 1.58 → 1.81 years in 3 months (+14.5%).
- Adjusts dynamically: Forecast updates as new data flows in.

Confidence Intervals in Forecasting
The shaded band around the forecast line represents the confidence interval, which is the the expected range of possible values. The dotted line shows the most likely outcome, while the shaded area provides the realistic range. This helps leaders plan flexibly, preparing for multiple scenarios.
Why You Can Trust the Model
HRBench uses proven time-series forecasting techniques, adapted specifically for HR data. The model learns from your data’s unique patterns, accounts for seasonality, and produces confidence ranges for clarity. With HRBench Insights, you’re not just reporting the past, you’re preparing for the future.